I'm posting this update on Saturday but wanted to keep this chart yesterday's EOD post.
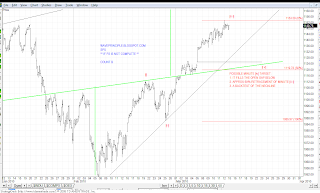
I looked at Option B again and played around with the Fibonacci ratios and the relationship of the waves. This chart above considers some potential targets using those relationships.
First off I find the blue Fib sets somewhat interesting. The Fibonacci ratio is clearly in play here and are very proportional.
Notice that minute [ii] is a near perfect 61.8% retracement of minute [i]. Price seems like it is ripe for a pullback right where the 1.618 (161.8%) mark is located and this is where I have labeled it minute [iii]. Minute [iii] also equals minute [i] at this level.
From here, all other projections rely on where minute [iv] is presumed to end. Here I use the 61.8% retracement of minute [iii], which is represented by the red Fib set. This is a generous retracement because it brings minute [iv] very close to the end of minute [i]. I do believe minute [iv] most likely will attempt to fill the open gap below at 1125 and certainly find some support at the neckline of the inverted head and shoulders.
So once minute [iv] is complete, two other Fib sets are used to project for minute [v]. The orange and green Fib sets come into play here.
The green Fib sets are identical to the blue one, which represents the length of minute [i]. So in this case, minute [v] equals minute [i] at approximately 1180.
The orange Fib set represents the length of minute [i] through [iii]. Minute [v] equals .618 times this length at approximately 1180, which is nearly the same as [v]=[i].
Does any of the above mean anything? Maybe not, but it is certainly possible that Fibonacci is at work here so it's something to keep in mind.
And don't forget that inverted H&S target, it equals approximately 1180.
-------------------------------------------------


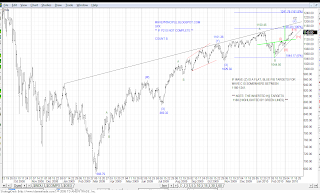
The top chart is an overview of my main count. We are in Minor C of Intermediate (Y). From there I have two ways to count Minor C.
Option A: 1154 Top
This option shows that we are in the midst of completing Intermediate (Y). All that is required is one little Micro degree wave up to complete it all. See the chart labeled "SPX Count A 60 Min".
Based on this count, I count Minute [v] as extended. Minute [v] is nearly equal to the length of minute waves [i] through [iii], highlighted by the red Fib lines.
A top here may be treated as a double top and possibly a sell-off come next week.
Option B: 1180 Top
This is a follow up to the option I pointed out this morning. Minute [iii] is nearly complete and minute [iv] most likely would target 1120-1125. These levels would coincide with the open gap below at 1125.12, the 50% retracement of minute [iii] and a backtest of the neckline. See "SPX Count B 60 Min" for a closeup of the structure.
Under option B, if minute [iii] completes near 1155 it would equal (approximately) minute [i]. If this were to happen, this may indicate that minute [v] will extend. That extension will be required if SPX were to target 1180, which again is the H&S target. So before I get into the fifth wave extension on the Option B count, let's see if minute [iii] and [iv] play out.
At this point either Option A or B may work. Option A may have an advantage given the fact that the SPX could not close over 1150, which to many may signal a double top.
We'll see next week!
No comments:
Post a Comment