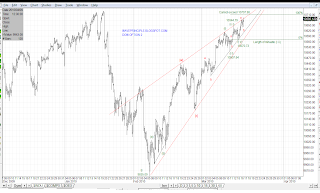
This is another count I have played around with. It is similar to a count I used for the SPX previously.
This count calls for a larger minute [y] ending diagonal to complete Minor C of Intermediate (Z). If this count is correct minuette (v) is in progress and is near completion.
Minuette (v) cannot exceed the length of minuette (iii) and therefore minuette (v) cannot exceed 10707.98. We'll see.
-------------------------------------

Here's the SPX. Looks like Option A is out from this old post. Option B, which has a target of approximately 1180 is certainly still in play.
Those Fib relationships from the previous post will have to be readjusted since minute [iii] appears to have pushed higher.
Though the DOW and SPX are sporting different structures, there may be a way to count them completing together. In order to achieve this, the SPX has to be re-labeled (which I have not done here) to show that it is in a final Intermediate wave (Y) up off the 1044.50 low.
Intermediate (Y) would consist of an a-b-c zigzag (on my chart, substitute the [i] with an [a] and [ii] with a [b]). The push off [b] is a [c] nearing completion. This would correspond with the Dow completing it's ED.
We'll see. I think SPX wants to hit its H&S target, plus there's a nice rising trendline above that it may want to kiss. I'll play around with the Fibs again giving the new level for [iii] and see if this will still work.
------------------------------------
[1:33 PM Update]

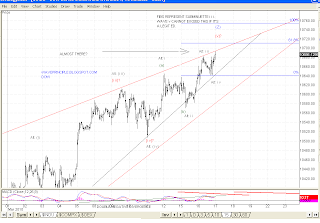
Here is a chart of a possible target if the alternate labels are in play. Subminuette v cannot exceed iii if this is a legitimate ED.
I'm not saying this is where the DOW is headed, but this would be the maximum if this count is the correct one and this ends in a throwover.
--------------------------------

Looks like the DOW is almost there. I cleaned up the labels a little bit but I think this is the best way to label it for now.
Notice the alternate labels in gray. This is another way to count it and if it is right, I also like the way the final minuette (v) gray counts (i don't have the subminuette waves labeled) as and Ending Diagonal itself.
I will post a SPX chart a little later. There has been talk of an expanding diagonal, which I had give some thought to when it was in it's early formation. It appears that there may be a legitimate one forming now. Check back later for that count.
Interesting chart. If you are correct, what is your target range for a pullback?
ReplyDeleteAnon,
ReplyDeleteThank you for the comment. Based on the count above, it is implying that P2 has topped or will top shortly. Once complete, I would be looking for a new impulse wave down to start P3.
However, what I haven't labeled as an alternate is that this may only be a Leading Diagonal wave A up. If this were the case, then a pullback for wave B would be expected under typical Fib retracement levels of 38% (10404) and 50% (10296).