[9:48 PM CHANNEL UPDATE]
Check out the channel. I labeled the price levels that the market would hit if it were to immediately drop to the corresponding lower trendline tomorrow. That won't happen so as time progresses, those levels will obviously rise. The chart is below.
[4:40 PM REVERSE FIBONACCI UPDATE : SEE CHART BELOW]
There is a large Fibonacci cluster at 1170. Hmmm....
--------------------------------------------------------------------------------------------------------There is a large Fibonacci cluster at 1170. Hmmm....
[2:30 PM UPDATE: 5 MINUTE CHART SEE CHART BELOW]
--------------------------------------------------------------------------------------------------------

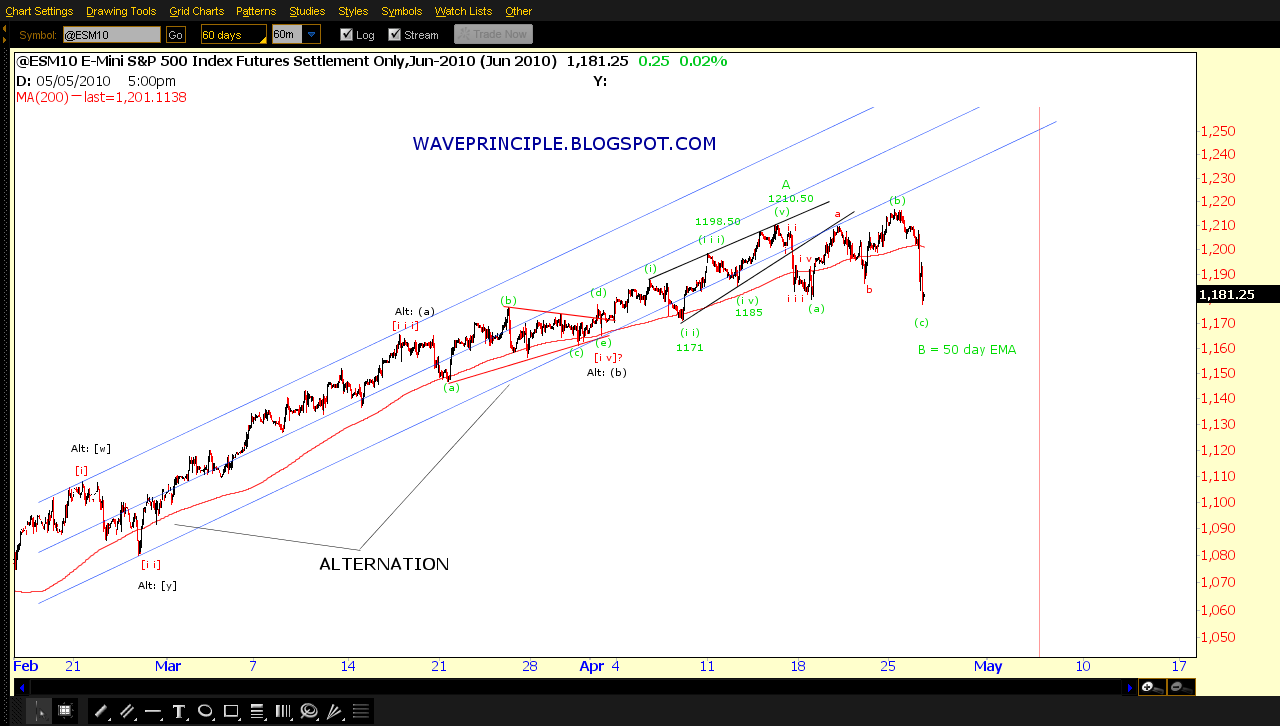
SPX DAILY - PREFERRED

SPX 60 MINUTE - PREFERRED

SPX REVERSE FIBONACCI SUCCESSFUL?

SPX TRENDLINES AND MAs
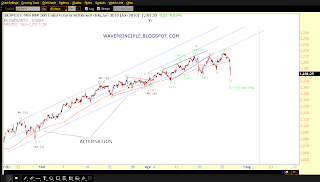 E-MINI


SPX - 5 MINUTE
Updated 2:30 PM
Updated 2:30 PM

SPX - REVERSE FIBONACCI
Updated 4:40 PM
Updated 4:40 PM

SPX - CHANNEL
Updated 9:48 PM
Updated 9:48 PM
I think it's safe to say we have hit a top of Minor degree. Based on my preferred count that would be a top of Minor A. There is still a possibility it is Minor C of "the top" but I won't go there just yet.
I'm happy we finally found some resolution on the direction here. It allowed me to eliminate the triangle and ending diagonal options that were on the table. I was getting tired of trying to keep up with all the counts.
The 60 min chart shows what I have us in at the moment. So far the move down may count as 5 completed waves. I'll try to post some 5 min charts later detailing this count.
I have the structure from 1213.90 labeled as an expanded flat in minuette degree. It is possible it may be of minute degree. The green Fibs on the 60 minute highlight where (c)/[c] may target. I'm showing a range between 1150-1170. This would also fit within a 38% retracement of Minor A.
The bottom two charts supplement the thesis that we have hit a minor degree top. Whether or not it is pure coincidence I like the fact that the reverse Fibonacci technique provided yet another indicator that a turn was imminent.
The trendline chart shows that the purple trendline finally gave in. The 50 day EMA sits near 1166, again a possibly good target for (c) / [a] of Minor B. For those wondering, the 50 day SMA sits at 1159.
Keep in mind on the 60 min chart, I still have a gray labeled alternate. Replace Minor A with minute [iii] and the current pattern as minute [iv] instead of Minor B.
GL!
yes today bear the force was strong and oh yeah now the trend is short or turned or will turn negative. But I speak for the short to medium and long enough is bull. Do not forget that even we did yesterday most. And we all know that the descent is always more violent.
ReplyDeletemy blog: www.mercadosbull.blogspot.com