
But considering all that, the bulls still have a case as well if you refer to the charts I posted earlier today.

Here's a follow up to the chart I posted earlier today at 7:05 AM. I pointed out that (ii) would likely target the MACD support line.
Look at the results by the end of the day. The signal line is turning up almost right on the money at trendline support and the histograms are indicating a signal is in store.
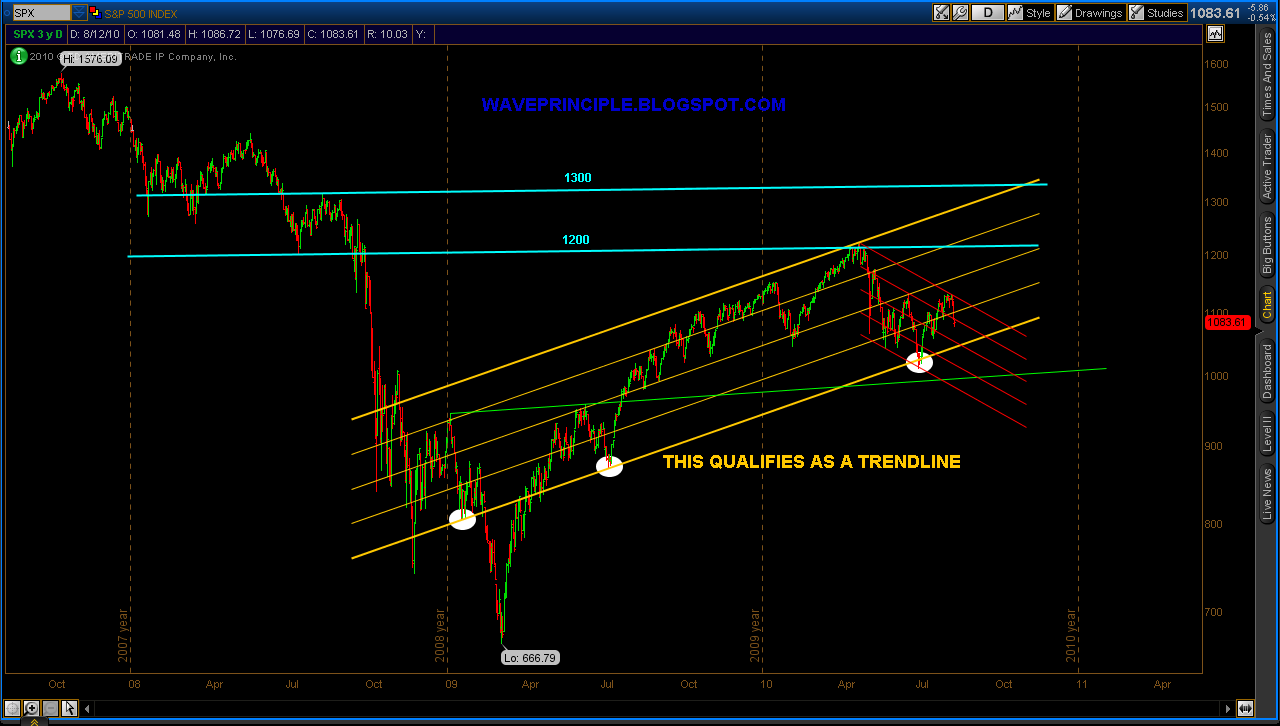
Looks like a new channel down. Must see if the lower channel line (yellow) holds.
