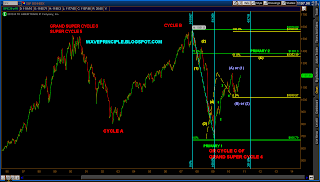
Not much to share tonight but this one simple chart, which I posted a few days ago.
First of all I want to briefly discuss the bear case. I don't want you folks to think that I am not thinking about that option.
IMHO the best the bears can hope for at the moment (at least the next 4-6 months) is a pullback back to 1000. I say this because if the bear count is truly still in effect, what we are seeing since the Apr pullback is a large flat.
Three waves down, three waves up. Follow the green highlights.
What do we know about flats?
EWP Rules (reference page 89, 10th ed):
- A flat always subdivides into three waves. Check
- Wave a is never a triangle. Check
- Wave C is always an impulse or a diagonal. We are waiting for this leg.
- Wave B always retraces at least 90 percent of wave A. We are just about there.
Guidelines:
- Wave B usually retrace between 100 and 138 percent of wave a.
- Wave C is usually between 100 and 165 percent as long as wave A.
- Wave C usually ends beyond the end of Wave A
Notes:
- When wave B is more than 105 percent as long as wave A and wave C ends beyond the end of wave A, the entire formation is called an expanded flat.
- When wave B is more than 100 percent as long as wave A and wave C does not end beyond the end of wave A, the entire formation is called a running flat.
Take a look at the burgandy Fib on the chart above. It represents the extension of Wave A and a 105% extension of A takes B to 1231. Interesting that this overlaps with the extension of wave 3/C at 1.618*1/A.
I mention this because this may provide clues as to what to expect for wave C down. Should we reverse short of 1231, we cannot expect Wave C to end beyond 1010.91, the end of wave A.
Should we reverse before wave B retraces A greater than 100%, again we shouldn't expect wave C to complete beyond 1010.91.
Going back to the top chart, the key marker will be 1129.24. If a pullback breaches this level, we will get confirmation that we are not seeing an impulse wave up off the July lows.
However, if this level holds, one must truly start to think of the following options:
1. Either Wave B is going to extend higher up to 138% of Wave A (at this rate that is 1300) if using the flat scenario above
2. The market is still in a Primary wave 2 correction targeting a 78.6% retracement of the bear market Primary wave 1 decline as highlighted by the chart below.
3. We are truly in a new bull market going to new highs.

Now for the near term, the triangle target is 1230. Wave 3/C = 1.618*1/A = 1231. Coincidence? Hmmm....
