[9:52 PM Update - MCCLELLAN BREADTH THRUST]
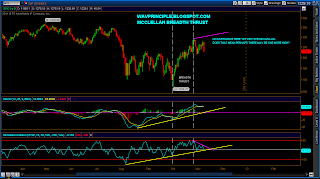 |
| McClellan Oscillator |
I previously wrote about the McClellan Breadth thrust
here on October 12. The SPX went onto rally from there.
I'm referring back to this now because in the stockcharts.com example, the NYA continued to advance higher even though the McClellan Oscillator continued to diverge after the thrust. I figure if something similar is occurring here, then perhaps SPX will make one more stab higher to form a divergence. We'll see.
[9:26 PM Update - DX]
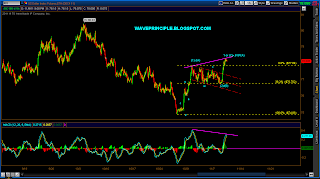 |
| DX |
Either the dollar completed wave (C) or only wave 1 of (C). The hourly MACD sports a negative divergence though so either (C) is complete or a wave 2 of (C) should be on tap.
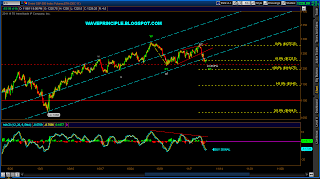 |
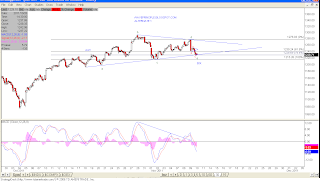
| ES |
So far ES is finding support where c=.618*a. There is also an hourly MACD buy signal too.
EOD Update
This is going to be a quick update again. No time tonight. I'll try to add more in the pre-market tomorrow.
The bears came back to life today and recharged the alternate 3 count. A daily MACD sell signal was put in today as well as a close below the 20 day SMA.
If the bulls want it back, they are gonna need to buy it up tomorrow or the bears just may have a gap and crap down to start the day. .
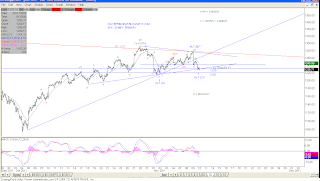 |
| Primary |
For the primary, looking for the completion of wave X which I believe was pretty much done at the close. There is room for a little further down so we'll see in the AM.
 |
| Alternate 1 |
Should this count pan out, I believe wave e of B/X triangle has completed. This version of the count will be ruled out once the market drops below wave c.
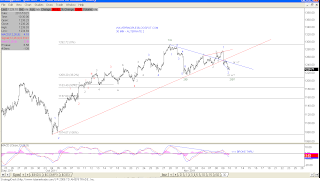 |
| Alternate 2 |
This is the uber bullish count and it to may be on the verge of invalidation. I show a wave 1 leading diagonal off the 11/1 low and today's sell off as part or all of wave 2 down. Wave 2s out of diagonals typically retrace 78.6%. It is pretty much there now so let's see if it reverses tomorrow.
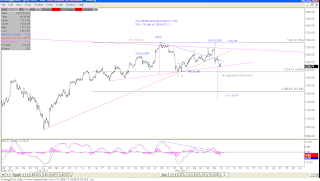 |
| Alternate 3 |
And last but not least the revived bear count. This count may have a gap and go drop tomorrow for wave iii down below the neckline. If this happens, coupled with a confirmed daily MACD sell signal, watch out below.
The market may be revisiting the mid 1100s again shortly.
 |
| Daily Bollinger Bands |
Showing the close below the 20 day SMA, the MACD sell signal and TL support.


