 |
| 9/4/10 update |
I'll have to organize all these options that I have presented over the past few months. Those who read regularly may have seen this one previously.
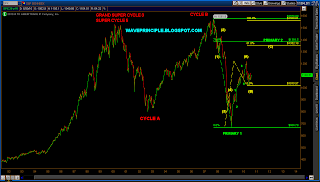
This count has us in (C) up now. This is bullish intermediate term but very bearish long term. Look at where (C) would hit if it were .618*(A). That's 22% away. There's almost a tight confluence with a 78.6% retracement.
Even though this would be considered an extreme retracement, it would make sense given the long term bull run. The market may still be in denial and the Feds last ditch efforts to "save" the economy pushes us to this extreme only to peter out.
Anyway, who knows for sure if this is correct but I keep posting bear counts that imply the market may go higher.
 |
| DOW Long Term |
 |
| Daily Preferred |
Ya'll remember this count above?? I haven't posted this in a while but it has been my preferred for quite some time now. Heck it's still in the link to the right but hasn't been updated since July.
Lately, I've only been focusing on the move off the April high and have lost sight of this bigger picture. This changes things a little bit (mainly the TOS charts I have been posting) but not the expected target in the intermediate term.
Based on this count I'm looking for Intermediate (Y) to complete. Based on this count it should end with a Minor C wave up. That is a 5 wave impulsive structure that I'm looking for and so far we are off to a pretty good start.
Some of you may be wondering, wait a second, you've been posting all these bullish looking counts all this time. Not so fast. I've put those options out there because they are good possibilities as well and I'll throw this count out in a heartbeat should it be ruled out. Until then the bull and bear counts point in the same direction so we must be mindful of them all.
But even with this bearish count I can still appreciate three bullish days in a row. It's been nice having been long since last Friday.
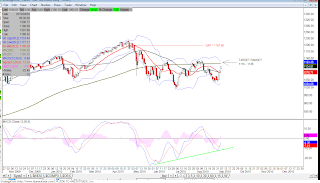
Up next should be a challenge of the 200 SMA at 1115.
 |
| MAs |
 |
| Bollinger |
 |
| EXPANDING OPTION? |
I just stumbled upon it today again and think it may still apply. This count implies that Intermediate (Y) is forming an expanding. I think this may work since all of the subwaves do look like threes.
I have a Fib extension projecting for [c] of 5 of (Y) on the chart.
 |
| Bullish Alternative |
Ok. That is all for now. Gonna enjoy the Labor Day weekend. I hope you all do the same as well.