Tuesday, March 26, 2013

3/26/13 - EOD Update

No change here. Watch that larger tri.

Bears know what level they need to take out.

60 Min 

Monday, March 25, 2013

3/25/13 - EOD Update

This morning in my Intraday post, I speculated whether the end of this leg up was complete (see purple tri).

The bears certainly were able to reverse the bulls initial move, however, until 1525.34 is taken out, one can never be too sure since a larger triangle may still be in play (see blue tri).

60 Min 

3/25/13 - Intraday Update

7:44 AM Update

Indeed the bulls pulled off the tri and today pushed out over wave {v} of (v)  slightly above (iii).

We'll need to keep an eye on the reversal here though since the count may be considered complete.

60 Min 

Friday, March 22, 2013

3/22/13 - EOD Update

60 Min 
No change from yesterday's post. The bulls are making that tri look enticing.

Thursday, March 21, 2013

3/21/13 - EOD Update

60 Min 

Another triangle or another truncated wave (v)? I posed a similar question last Fri on the 5 min chart. 

The bears may have the daily MACD bear cross in their favor along with a lower high since 3/14. Or are the bulls just consolidating yet again under a key level?

Wednesday, March 20, 2013

3/20/13 - EOD Update

60 Min 
Are the bulls trying to wrap up wave (v)? Or possibly just consolidation under the 1557 level before blasting higher to an all time high?

DJI - Weekly


The DJI has broken through the wedge so far an may be aiming for the upper channel. Interesting though that the SPX is still lagging.

Tuesday, March 19, 2013

3/19/13 - EOD Update

Bears may have dropped the ball today. Earlier today, I tweeted the 5 min chart highlighting the line the bears needed to defend.

5 Min 
As you can see, there is overlap after overlap so there is a strong possibility that the double zigzag wxy is the correct wave count.

60 Min 
Wave {iv} is still a top contender. Bears needs to flush it now to account for all the overlap if they want to push the market lower in an impulsive fashion.

Monday, March 18, 2013

3/18/13 - EOD Update

I posed the question last Fri of the potential truncated 5th vs triangle option. So far that may be playing on the 5 min.

However, until the bears can break through 1525.34, this pullback may still be a wave {iv}.  Let's see if the bears can take advantage of the European volatility.

5 Min 

60 Min 

60 Min

Friday, March 15, 2013

3/15/13 - EOD Update

I've added this 5 min chart highlighting the potential truncated fifth or yet another triangle in the works. We should know pretty early next week what it is going to be.

5 Min


Has the SPX finally seen the end of this leg up off the Feb 26 low? We'll see. I'm watching the hourly divergence (see the last chart below).

10 Min 

60 Min 

60 Min Divergences

Thursday, March 14, 2013

Wednesday, March 13, 2013

3/13/13 - EOD Update

Near term the bulls and bears are battling it out again.


5 Min 
Bulls in blue. Bears in red. Who will prevail?

60 Min 

I tweeted earlier that I'll be keeping an eye out for a potential tri or flat. This could very well be playing out if the bulls do not push the market over the 3/12 high. This would represent a tri or flat for wave {iv} as the alternate.

Tuesday, March 12, 2013

3/12/13 - EOD Update

Did the bulls just buy another dip? It is very possible.

The market finally came within 7/10 of a point of the head and shoulders target I have had on my 60 min chart. It also looks like five waves up can be counted as complete.

Will the bears every show up?

SPX is still dragging behind the DJI, which posted another all time closing high. SPX has yet to surpass it's 2007 all time high.


3 Min 
Bears need to act tomorrow at the open if they want to start something, otherwise the bulls are looking to march higher and challenge the 2007 high.

60 Min 

Monday, March 11, 2013

3/11/13 - EOD Update

Wave (iv) appears to be an ascending triangle. Lets see if the market provides another thrust higher to complete (v) and challenge the all time high which the DJI has already done.

60 Min 

Friday, March 8, 2013

3/8/13 - Intraday [9:03 AM Update]

[9:03 AM Update]

Time to take a little short position?

10 Min


I switched this to a 10 min chart. If {iii} is complete, some {iv} Fib targets. So far looking good. 

Thursday, March 7, 2013

3/7/13- EOD Update

I had nothing to contribute intraday. Certainly looks like a triangle.

Lets see if we get the wave (v) spike on NFP numbers and see what happens after that.

5 Min 

60 Min 

Wednesday, March 6, 2013

3/6/13 - EOD Update

The Market continues to stair step higher in an extended wave.

Wave (iv) appears to be triangulating. One thing to note is the 60 min MACD bear cross.

The wave {i} high at 1525.34 will be the level to watch near term to indicate a change in trend.

5 Min 

60 Min 

Tuesday, March 5, 2013

3/5/13 - EOD Update

60 Min 
P3 bears are dead. Lets see if {iii} of (v) wrapped up today.

On the 60 min, it actually looks better as a 3 of {iii} that may have wrapped up today. I'm not so sure though because a closer look at the squiggles does not support that.

3/5/13 - THE P3 BEAR IS DEAD

DJI
See ya later!

Monday, March 4, 2013

3/4/13 - EOD Update [9:00 PM Update]

[9:00 PM Update]

60 Min
Here is a chart that isolates another version of a flat for wave 4. This is highlighted in red. Wave b of 4 is a triangle.

EOD Update

Not much to add. This is still choppy action.

The bulls may have added a little to their case, however, note the larger flat potential as the blue alternate.

The red option is pretty weak.

5 Min 


60 Min 


Sunday, March 3, 2013

3/3/13 - Update

Kind of a tough read at the moment.

Case for the bulls:

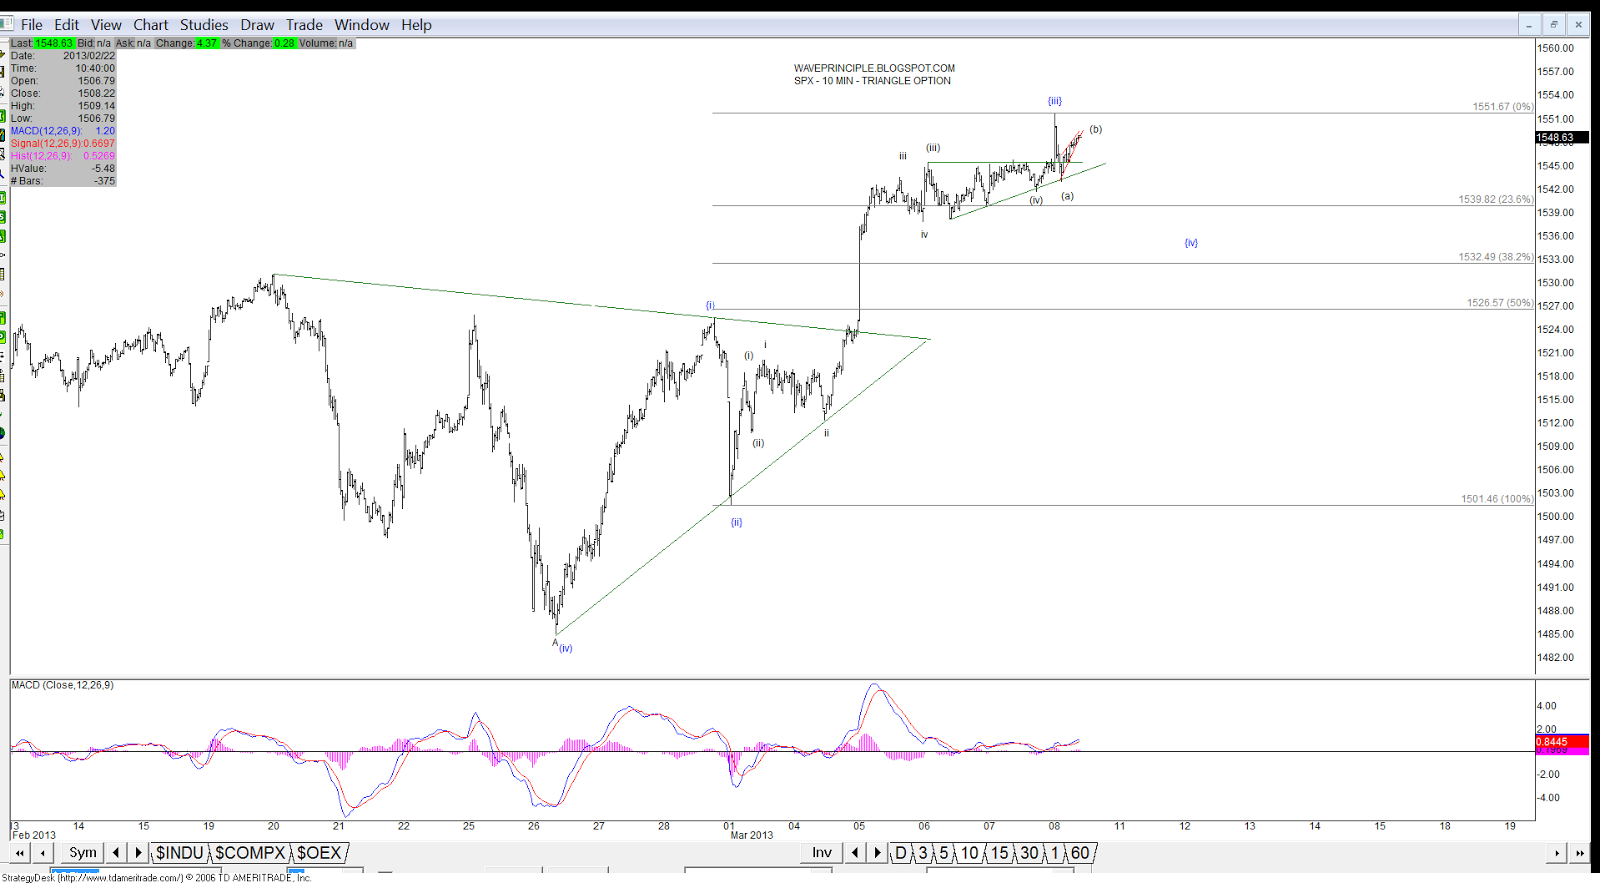
1. The wave off the 2/19 high is best counted as corrective at the moment.
2. Price is still tracking up the ascending trend line
3. The blue count shows wave (iv) either complete or working on a potential triangle


Case for the bears:

1. 60 min MACD bear cross
2. The bulls have not made a higher high yet since 2/19.
3. The weekly chart is wrought with negative divergence and it still looks like one humongous wedge.
4. There's room, even tho it supports the bull count, for one more wave down to approx 1480 (11/16/12 - 12/28/12 trend line) to complete a larger wave (iv) flat.

5 Min

60 Min 

Weekly