
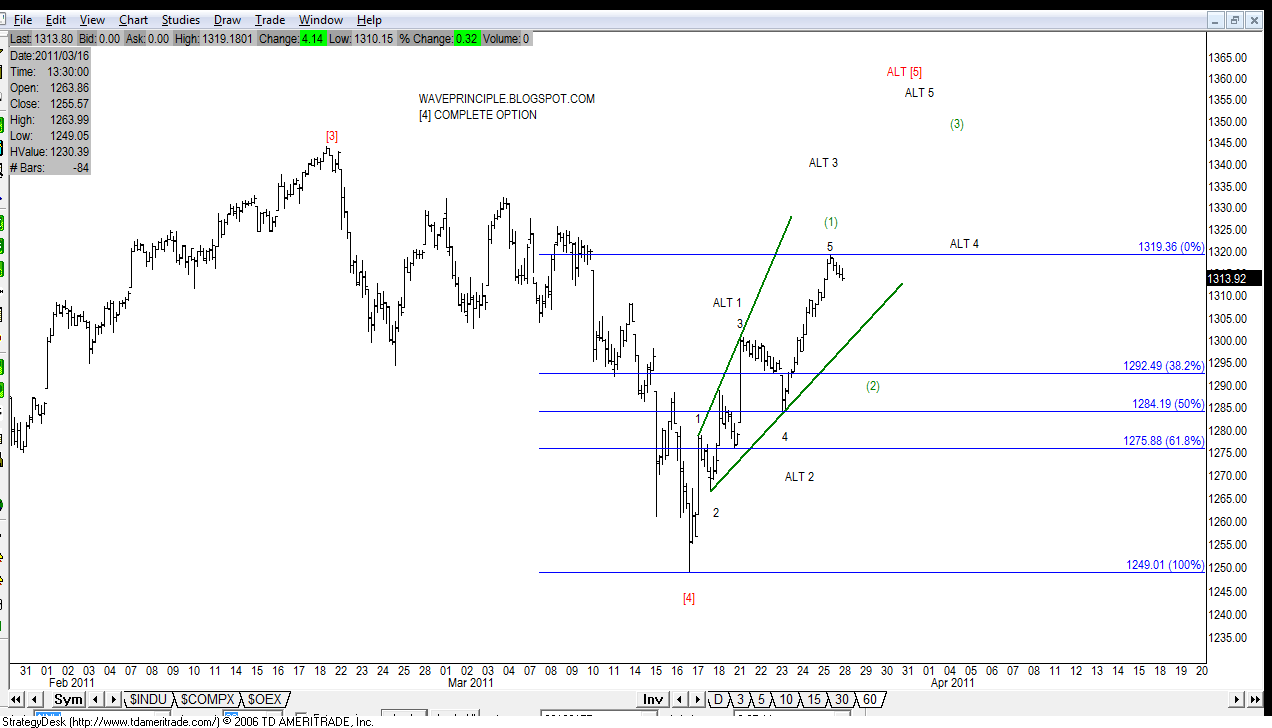
SPX - 30 Min Primary
Pretty much still looking for an end to wave (x). Notice the alt labels on the chart.

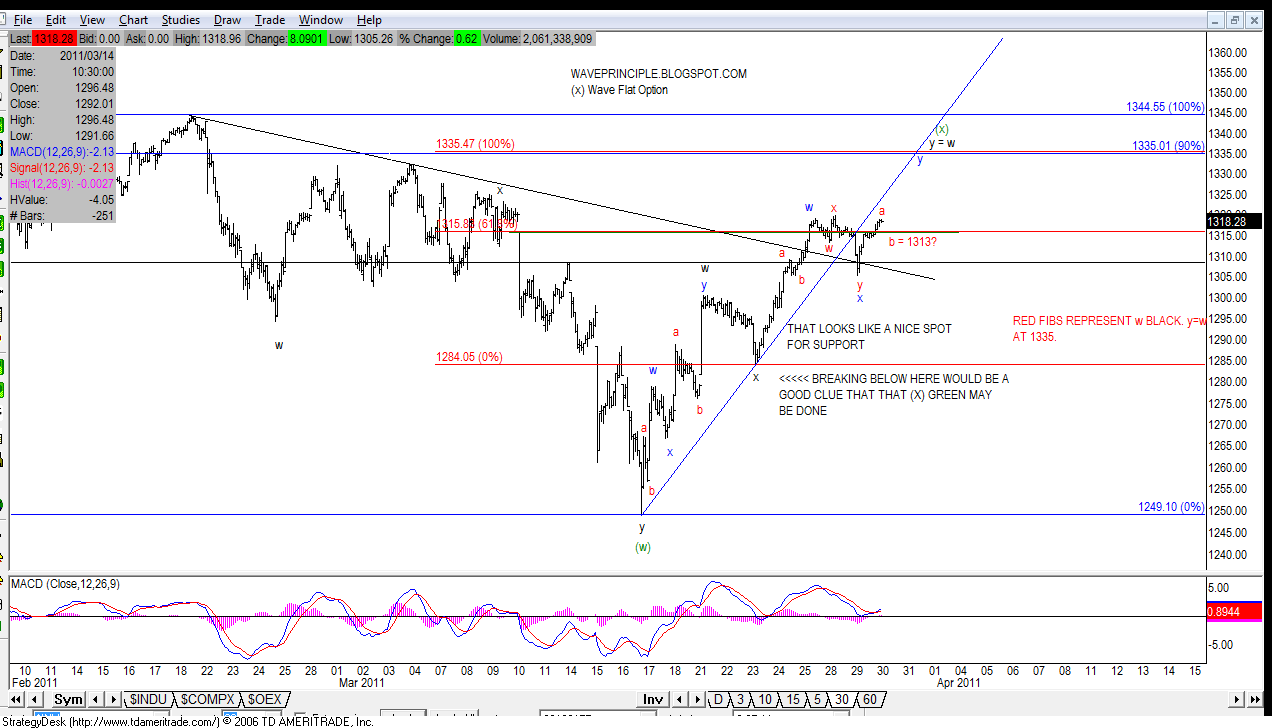
INDU
An INDU count to be mindful of.


 Here's another optional pattern to watch out for. Given the daily macd bull cross, this may play out as it slowly churns the weekly back towards positive.


 I believe wave a of y of (x) completed today. I'm expecting a wave b pullback towards teh Fib targets below before a push higher.


 Here's a look at what ES may be doing.


 Some inverted head and shoulders targets.
 A possible path the market may take if the various options play out.
 This chart has come in handy. The behavior of the market continues to mimic the Apr market. If this continues, the market will rally at the open tomorrow and then close in the red.
  --------------------
 If you folks have been following this chart once again playing true to the script. A test of the 50 day SMA as anticipated.
  The inverted h/s targets.
 A case can be made for a completed w-x-y correction.
 The original impulse count option I presented over the weekend is out due to the 4-1 overlap. However, the nested 1-2 option must be considered as well.