[5:15 PM Update - A CORRECT START TO IMPULSE]

Finally I came up with a legitimate count that shows a potential impulse down in the works. Keep in mind this is still only three waves down as noted on the chart.
The market must make a lower low and not break above the horizontal line before making the lower low to confirm there are five waves down.
EOD UPDATE

Is this script playing true to form? If Apr is repeating, the market should rally Monday and test the 50 day SMA. A few charts below support a rally to that level early next week. What it does after that should it get there will be telling.
One thing to note is the daily formed a shooting star just shy of the 13 day EMA. Hmm....


Daily Primary Count
Here's my primary count with a few options:
1. Minute [5] underway
2. Wave (x) of [4] is underway
3. Wave (x) of [2] of Minor 3 is underway.


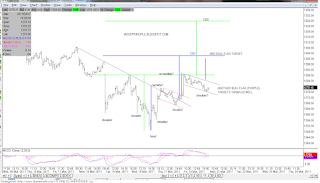

30 Min

5 Min

Inverted Head and Shoulders and Bull Flag
Both these patterns support a move to the 50 day SMA.
 This supports option 3 on the daily chart above.

 This supports option 3 on the daily chart above.
Weekly
A weekly hammer formed. Next weeks results will determine if it gets confirmed or denied.