Sunday, January 31, 2010

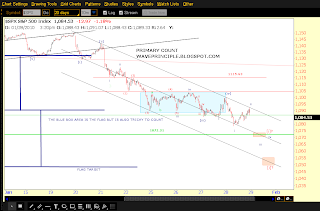
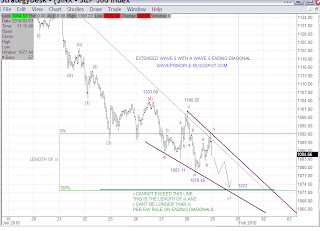
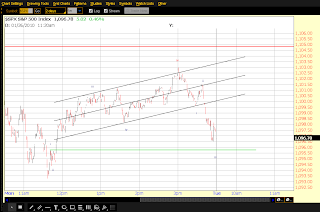
1/31/10 - SPX Alternate Count [2/1/10 6:15AM ALT COUNT UPDATE]

[2/1/10 6:15AM ALT COUNT UPDATE]


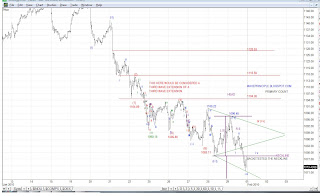
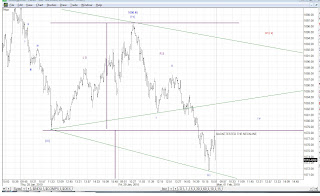
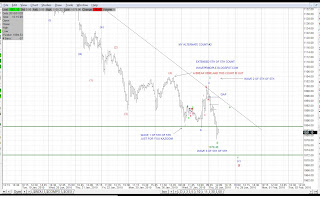
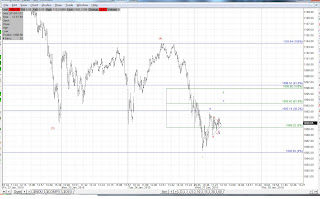
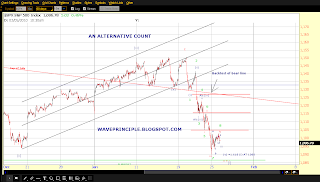
This is one I'll be keeping my eye on. Once again the squiggles in the sideways moving waves poses some confusion. Either wave d (green) is in or there is a little more to go before a wave e (green) bounce to complete (4) red.

1/31/10 - SPX Primary Count [1:45 PM Update Squiggles]

[1:45 PM Update Squiggles] THE PRIMARY COUNT IS THE LAST CHART BELOW
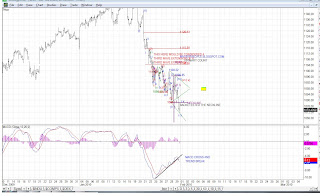
60 min MACD cross and trend break


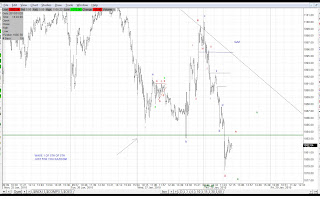
Squiggle Part 1


Squiggle Part 2


Squiggle Part 3


Squiggle Part 4


Squiggle Part 5


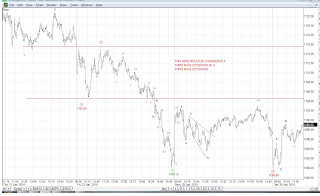
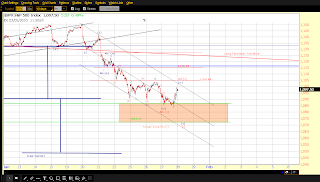
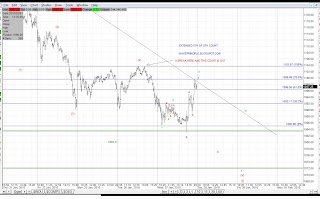
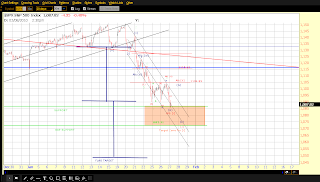
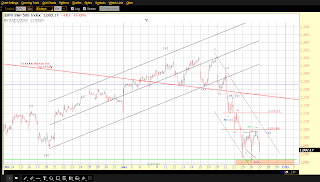
Ok. I hope this makes sense to you all. The first chart is messy because it is hard to scale down so that you can see the overall picture. I included the chart only to show you the 60 minute MACD. MACD crossed it's signal line and broke below the trend it has established up. I'm treating that as a signal for more downside to come

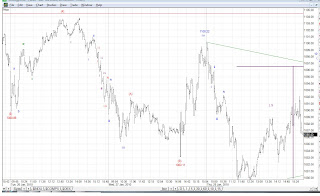
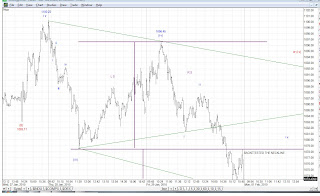
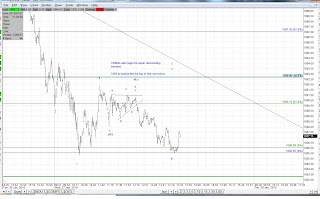
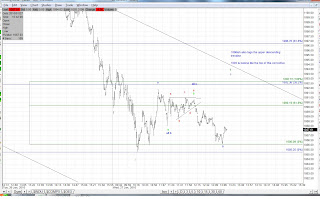
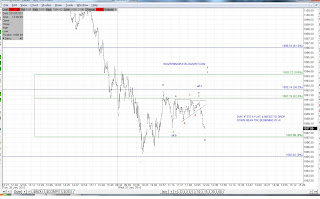
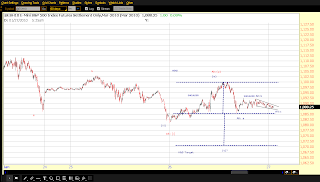
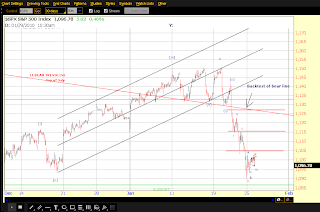
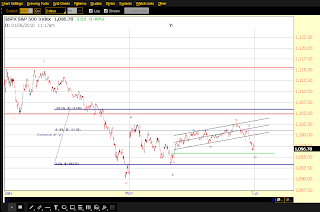
The subsequent charts highlight the squiggles in parts so that you may see the details. I think I overlapped them enough so that you may see where you are in relation to the previous chart.

...And that is how I arrived at my primary count below.
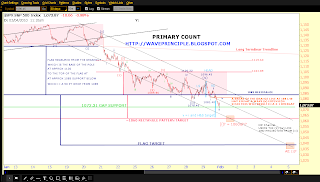

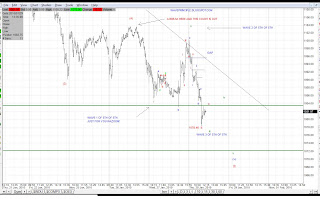
PRIMARY COUNT-1/31/10


Ok. My eyes are extremely strained at this point. I have spent some time (hopefully not in vain) trying to decipher the squiggles throughout the sideways move. I think it is very important to figure this out because of the overlapping nature of the waves.

For all we know, there may be one more wave iv of some degree working out. This will make all the difference in determining where we should expect wave (v) of minute [i] to complete.

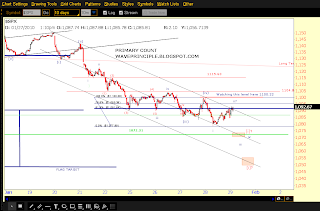
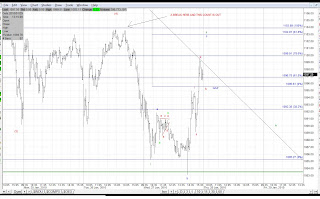
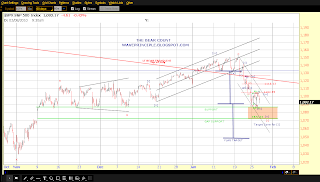
Above is my current primary count. I'm going with this and expecting wave (v) to hit 1060 for the following reasons:

1. Wave v of (v) = i of (v), assuming iv is done.
2. Projecting for wave (v) by utilizing an EW channel. This was achieved by using the (ii)-(iv) line and drawing a parallel to (iii). (v) is expected to hit the lower trendline.
3. The Head and Shoulders expected target arrives at the same level.
4. A valid rectangle pattern arrives at the same level.

Things to consider:

1. Minute [i] may be considered complete.
2. Flag pattern target = 1040s.
3. Wave (v) may extend **See Note Below**

Check back later because I will post charts highlighting the squiggles. There will be several charts in order to capture each segment.


**Note**
: In a previous post, I wrote about an extended wave 3 of an extended wave 3. Given this and typical wave behavior, it was expected that wave (v) would simply equal wave (i). I based this on the following obtained from EWP (pg 32), "The vast majority of impulses contain an extension in one and only one of their three actionary subwaves."

However, it should be noted that this is not a set rule, but more so as a guideline because the rest of the paragraph from the book reads,"The rest either contain no extension or an extension in both subwaves three and five. So though very rare, we still must keep this in mind as a possibility.
Friday, January 29, 2010

1/29 - EOD Update [1/30/10 10:15 Update]

[1/30/10 10:15 Update]

***NOTE*** Things can get hectic with the counts as there are always several possibilities. I know it is hard to determine what my primary and alternate counts are at any given time since I am always updating and posting new charts constantly. Unfortunately that is the nature of counting waves. What I present in my posts are my thoughts as things are unraveling, however, they are not necessarily what I may consider to be my primary count.

So to make things easier for everyone who wants to know where I stand overall without having to scroll through the blog, I have included a link to the right which will include what my primary counts are for the indexes and alternates. I hope this helps.

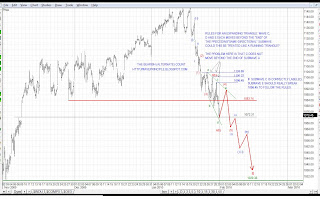
As for the Ending Diagonal count as it is labeled below I am ruling this alternate count out for now. I overlooked the fact that wave iv was longer than wave ii, which is a rule violation for a contracting ending diagonal. This does not mean it is not wedging and it is still possible an Ending Diagonal is in the works. I will have to visit that later as the waves unfold.

I will be posting an update for my primary count later on in the weekend.

[5:20PM Update]
The Alternate Count


Wow, look at the result of this alternate count that I posted yesterday. I didn't move a thing except for the iv and v label. I'll post more on this later this weekend! v may have a little more to go.

SPX


E-Mini


Just something to chew on at the end of the day. Will try to put out more over the weekend. Gonna enjoy the rest of my Friday.

1/29/10 - AM UPDATE _ PRIMARY COUNT EDITED


Morning folks. Sorry for getting this updated count out late. I've been busy in the Circle Community and my system has been running slow.

The morning's pop forced me to revert to my original count all along. It is listed above. Nothing really change though. My target is still 1075ish for this minute [i] bottom.

As in my previous post, I am not expecting (v) to extend because (iii) already has. One thing I need to look into (and I think may be acceptable) is that wave iii of (v) could potentially extend.

Well get back to you on that. Until then. I'm looking for 1075. Either way, if there is a way to count down to 1050, I would expect 1075 to provide some temporary support and a bounce up from there.

I'll post a more updated chart here in a little bit since my system is slow.

Thursday, January 28, 2010

1/28 - SPX NEW COUNT

SPX Line Chart-Primary Count


SPX Bar Chart-Primary Count


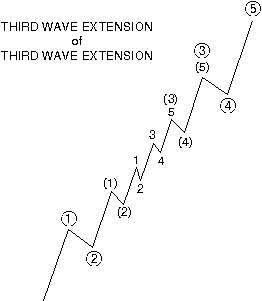
Third Wave Extension of Third Wave Extension Count

Courtesy Elliott Wave International


Fifth Wave Ending Diagonal-Alternate Count


Alrighty. I had a chance to look at the charts again tonight.

First off, I have to thank Geno0010 from the Circle Community Lounge. He pointed out the truncated (5) wave in red on my first line chart I posted this morning. I didn't get a chance to follow up on it until tonight and realize that this current count works very well.

See my post from earlier this morning.

The line chart provides a little clarity and presents a good looking wave structure. The labels on the line chart work well with the bar chart as well.

Based on this count, there was a third wave of a third wave extension. I have posted a chart from Elliott Wave International as an example. Compare the two and it looks pretty good to me.

So if this is correct, there may/should not be any other extended wave in this structure. Wave (v) should just equal (i). On the chart, I projected the distance of wave (v) using the length of wave (i) and came up with 1070.

I think this is a very likely level since I have been commenting all along that price will try to fill the 1072 gap below. 1070 would be a perfect level to test the gap and most likely end minute [i].

My alternate count remains the same and the expected level is approximately the same.

Tomorrow will be an exciting day. As I complete this post now, E-minis have given up another 6-7 points so far. We'll see how she fares in the AM.

Good night!

1/28 - EOD UPDATE

PRIMARY COUNT


ALTERNATE COUNT: ENDING DIAGONAL

Well, here we are, still trying to find the bottom. I hope the line chart I presented this morning was helpful.

There were a few options I presented throughout the day in the Circle Community Lounge. In the end I had to make some changes to my labels and for now will present the two best counts as far as I can tell.

There is one 3rd option, an uber bearish one, and Columbia1 has this one laid out. It is very similar to my previous uber bearish 5th of a 5th wave extension but my labels were slightly off. See Coumbia's count here.

The two options I have on the table are ranked as follows:

Option 1: The first chart. It should be self-explanatory. It has been my primary count now since this drop started. The only thing that gives me pause is how to count the squiggles in the blue box. I think I have it right but I have also seen other options that may also be right.

I am expecting five waves down to complete minute [i]. Two of those waves may have already completed. We may see the open with a drop tomorrow since it will have to be a third wave down.

Option 2: This option, though it is an alternate, I like quite a bit. There is a slight possibility the subwaves do not count out well as 3-wave structures as they should for an ending diagonal. But so far, it "looks" pretty and counts fairly well. I also have it finishing up wave five.

The difference with this wave 5 down is that it will look like a zigzag or 3 waves. This last wave should not exceed 1072 +/- 1 since wave v cannot be longer than wave iii. I have the distance of iii marked on the chart.

So, for now, it is pretty easy. Looking for 5 waves down total tomorrow. If it looks like only 3 waves are playing out, I will refer to the Ending Diagonal chart.

And last but not least, I'll be keeping an eye to see if this last fifth wave begins to extend. It certainly is an option. I forgot to mention that if it does, the flag formation indicates a move to 1050, which I believe an extended 5th of a 5th can take price to.

Unless I can think of anything else, this is it for now and maybe you can join me in the Circle Community Lounge tomorrow for some real-time wave counting.

1/28 - SPX Line Chart [12:20 PM Update]

[12:20 PM Update]

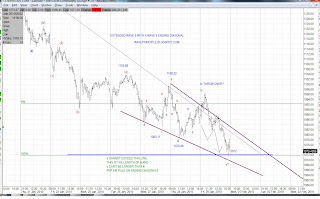
This is another option I have on the table. A possible final 5th wave Ending Diagonal to complete the extended 5th wave. The projected target for the last v of (v) would end near 1072.

My alternate count #2 option is off the table for now, at least by the way I have counted it. Columbia1 has a count similar to mine that would still work for the 5th of 5th.

[9:25 AM Update]


Here's a squiggle count of the 5th of 5th extension count. I show wave iii extending.
[9:00 AM Update]
My Primary Count


Alternate Count #2


So far the primary count looks good. I have (v) in the works. However, My alternate count #2 is looking pretty strong and may have to become alternate #1 or my primary altogether. Wave 3 of the alt2 count looks like it may be extending.


,
7/28/09 Before Line


7/28/09 After Line


7/28/09 After Bar


This is a line chart of my primary count. I think using this method helps smooth out the wild fluctuations that may distort the waves. I believe Prechter would agree because in Elliott Wave Principle (EWP), Pg.70, Prechter states that RN Elliott and A. Hamilton Bolton all kept an "hourly close" chart, one showing the end-of-hour prices. Unless I am missing something, I believe this is the same as using a line chart. Prechter and A.J. Frost utilized this as well.

In the case of my primary count above, the line chart shows a pretty clear structure. The nested 1-2s are quite obvious here.

I have an example where I used the line chart on July 28, 2009. See Post I used the same charting method to determine whether we were in a triangle.

At the time, I think there were many interpretations because the squiggles were everywhere. In fact, the comment posted by bruiser at the time shows the various views points and uncertainties.

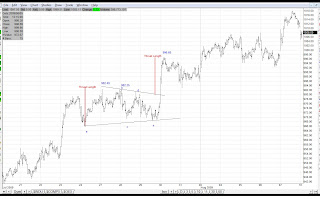
The line chart presented a clear picture of 3-wave (a-b-c) structures indicative of a triangle. The one mistake I noticed I made back in July was how I projected the thrust. I was off a little, but notice, had I measured correctly, how fairly accurate that thrust was?

Does all this mean anything? Who knows but I will say its just something else to think about and add to the analysis. July seemed to work out pretty well or I'll just say it was a lucky call.

Wednesday, January 27, 2010

1/27 - EOD Update [9:55 PM Update]

[9:55 PM Update]
One more update. This is a correction of my alternate count2. For some reason, I labeled my wave c of ii as and abc, whereas a clear 5 wave impulse up may be counted. It cannot be seen on the 5 min, but the 1 min shows an open gap below at 1095.60. I believe wave iv of c will most likely retrace to this level.

I have taken the measurement of wave i and projected from this gap what I feel may be wave v of c of ii. A .618 relationship to i places price near 1103. This will have to be just about it if this count is to work.

The key tomorrow will be to see how far this move up retraces once it completes. Obviously a break of the start of b (blue) at 1083.11 will confirm that ii is complete. A break above 1103.68 confirms minute [i] is in and [ii] is in progress.

[9:05 PM Update]


I had to make a correction in one spot (for now). I moved my minuette (iii) and Alt:[i] label to the 1085.32 low on 1/27.

Primary count with Alternate 1


Extended 5th of 5th Count: Uber Bearish Count


Extended 5th of 5th Count: Uber Bearish Count Closeup


Ok. My primary count is above. Minuette (iv) is in play and will most likely get stopped at the trendline. Minuette (v) to follow near the target zone.

I have two alternates I am watching that I feel may go either way.

The first is listed on the top chart. That would make minute [i] complete today at 1083.11. Minute [ii] is working it's way up now. Target near 1114.

The second alternate (second chart) I have, I posted on throughout the morning in the Circle Community Lounge.

****Note**** I have to apologize in my earlier charts, I had the wrong trendline drawn in for this uber bear count. I have since made the adjustment and it is nice that price ended the day right at the top. Sh!t happens when your trying to look at all the possible counts. Nothing has changed by this oversight, in fact it helps confirm that the count is still in play.

So the 1st alternate count has us in minute [ii] but my primary and alternate 2, though counted differently, takes us to the same level (1072ish) for the most part.

1/27 - SPX AM Update [10:40 AM Update 5th of 5th Extension]

[10:40 AM Update 5th of 5th Extension]

Wave c of ii is in progress. 1093 looks like a potential top for this retrace. It is a 38.2% retracement of the leg down that ended at today's bottom and c of ii = a of ii here as well.


[10:15 AM Update 5th of 5th Extension]

Looks like c of ii is in progress. 1093 is looking like the target zone!
[9:20 AM Oops! My bad!]


[9:00 AM Update 5th of 5th Extension]


Let's see if the bulls can break her above 1096. If not, this count may just work.

[8:30 AM Update 5th of 5th Extension]
Here's that 5th off 5th extension I mentioned below. I know it's a really bearish count and the probability is low, but it is something to keep in mind.

[7:50 AM Update]
Here's and update of my overall count for now with the alternates.

Check back in a little bit because I'm going to post a potential count in the event that there is a 5th wave extension of a 5th wave extension. Somehow, I think this may be a possibility however remote because the 1072 gap just seems to stick out.


This is how I'm counting this move so far. By my primary count, minuette (iii) is wrapping up. I'm expecting a push up/sideways for (iv) and probably no more than 1104.

Tuesday, January 26, 2010

1/26 - E-Mini PM Update: H&S?


It appears a small scale head and shoulders formation may in the works. How it fits into the wave count I'm not completely sure. Based on my current count, it may result in a drop down for wave (v).

I'm not quite sure this one is completely valid. The measured move would take price down to 1070, a 1.5% move. That's pretty big. It would make wave (v) approx 1.236(i).

Let's see how it plays out. Many of the H&S patterns have been playing out so this one may not be any different.

And of the course the alternate count is that minute [i] was put in today and the bounce the beginning of [ii]. By my count (a) played out and (b) is just about to complete with a final (c) wave up to complete [ii].

1/26/10 - SPX EOD UPDATE


There was a lot of commentary in the Circle Community Lounge today (See link above to participate). I was able to participate sporadically. One thing I commented on was how much I did not like the channeling of the structure starting from the 1147 high on 1/19.

The structure I'm referring to was the alternate count I had listed last night. I felt waves 2 and 4 (minuette) did not create a good channel and just did not look right proportionately.

The bounce off the bottom this morning was not convincing. It appeared to be weak and could not get above 1104. The structure appeared to be forming an expanding triangle and if anything moved sideways taking on a bearish flag pattern.

There is still a way to count this alternate, however, I still like the nested 1-2 count. Support is strong at the 1090 area, which in the case of the alternate count, may be where minute [i] ends.

For now, my preferred count is that we are in wave v of minuette (iii) with a target near 1090-1085. I would expect a bounce to complete minuette (iv) and then a final minuette (v) back down towards strong support or possibly challenge the 1072 gap below. So a bottom for minute [i], though somewhat wide, is between 1085-1072.

Something to keep in mind is the possible bear flag pattern, which is considered a continuation pattern. This pattern suggests, if correct, a more bearish move to 1050. Not sure about this, but something to keep in mind.

Monday, January 25, 2010

1/25/10 - SPX AM UPDATE [3:40 PM UPDATE]

[3:40 PM UPDATE]

Here's an alternate count addressing the 7 waves I posted about the other night. This count would get us 9 waves to complete this impulse down and wave 5 would be considered extended.

There is no rule violation here either with regards to wave 3 since it is still longer than wave 1. I have highlighted all 9 waves in green. There are some Fibonacci confluences here to.

Wave (v) blue equals wave (i) blue x 1.618 near 1088 and wave v red equals wave i red at 1085. This area is considered a strong support area (though the DOW has broken down through it).

If this alternate count pans out, we should expect minute [i] to end somewhere near 1085-1090.

I still like the nested 1-2 count and it is my preferred but I will say this alternate is very close as well. If price smashes through 1085 convincingly, then I think I can say my preferred count is certainly playing out.

[EOD UPDATE]


Since 1104.89 was not taken out, the nested 1-2s (3 total) are still in play.
It looks like wave iv (red) of the 3rd set of 1-2s completed today.

The move up from Friday's 1090.18 low counts well as an a-b-c corrective. Many overlapping waves and a wave 'b' triangle to boot. The final wave C, which I was speculating on the CiL to be an ED turned out to just count as a 5 wave impulse up. The waves channeled well, with a 5th wave throw-over to boot.

I labeled what appeared to be a new impulse heading back down. Granted it may also count as only 3 waves down so far. A break of 1095.74 to the downside will truly confirm that this corrective move up is over.

One thing I noticed today is how long the waves took to build up, only to lose half of it's progress within the last 10-15 mins of the day. To me that signals weak momentum to the upside.

[10:40 AM UPDATE]
And the alternate count.

[10:30 AM UPDATE]
Looks like that ED only completed wave iii. The next best count I have here is that wave 5 completed, backtested the rising trendline for wave 3's ED and was rejected. Breaking 1095.74 will confirm this corrective wave up is over.

[10:00 AM UPDATE]

I'm thinking wave 5 of C is ending in an Ending Diagonal.


Following up on Friday's post, I'm showing a wave iv corrective off Friday's bottom. This would be wave iv (red) of what I believe to be either micro or submicro degree. It is part of the 3rd nested 1-2 count.

Wave c of iv was about to begin and using Fib relationships, c=a=1105ish and c=.618a=1100ish.

It cannot exceed 1104.89 or there will be a 4-1 overlap on the third nested 1-2. Will see.