Thursday, June 30, 2011

6/30/11 - EOD Update


On Tuesday I posted that I believed the market was headed for 1313-1320. Look at where we are today.

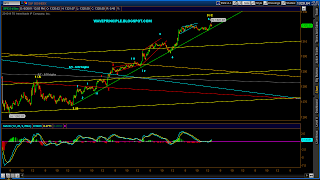
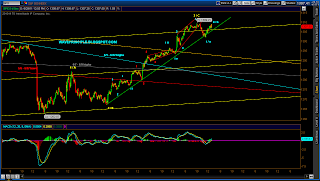
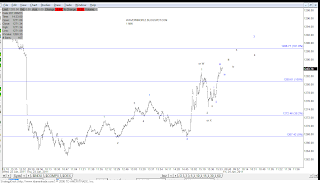
Below the daily and 5 min chart presents a strong case for the completion of wave [d] of the triangle.

The final gap up near the close may be an exhaustion gap and with the sharp reversal after the gap leads me to believe that at the minimum, this leg up is complete.

The alternate options are:

1. Wave 3 of c of [d] completed today
2. Wave w of [d] completed today
3. Wave 3 of 1 of Minor 5 in progress

So if wave [e] is in progress, I'm seeing a Fib confluence near 1298 as a possible target.


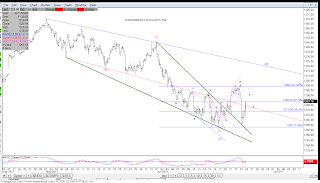
Unless it breaks out, the Eur/USD looks like it's in a similar situation.

Wednesday, June 29, 2011

6/29/11 - EOD Update [8:42 PM Update]

[8:42 PM Update]


Earlier today in the chat room I was looking for a 9th wave for ES. Well it looks like we may get it in the form of a wedge, which would be fitting for the end of this leg.

EOD Update

60 Min

As I posted last night, should 1300-1303 be taken out, the market may head towards 1313-1320. So far this third leg wave c/y for [d] is on track.

I haven't had a chance to drill down the squiggles, but it may be pretty close and in fact, the 5 min chart below has one option for that. It is possible the move at the top there may be setting up a flat so we'll see what tomorrow brings.


Minor 4 Triangle
This is still my primary count.


Here's a bullish channel I'd been watching along with the MACD trendline. The trendline was broken thru last week.

If history repeats, this is a pretty similar looking pattern.


Tuesday, June 28, 2011

6/28/11 - EOD Update - 1313-1320 TARGET? [10:20 PM Updte]

[10:20 PM Update]

RUT Daily

Another take on the RUT count.

REPEAT?

Another repeat? Remember november last year? Many were counting that pull back as the beginning of a new five wave move down. So just be careful if you are biased with the bearish count.

EOD Update

My triangle is still the primary count and so far things are point up for the completion of wave [d]. It is possible that Minor 5 may be in progress but I'm still having thinking the move off the 6/16 low may not be impulsive.

1300-1303 looks like the next area of resistance. If it can clear this level, I think 1313-1320 is next.

Reasons why the market may be headed for 1313-1320:

1. The 50 day SMA at 1316.89
2. Upper daily Bollinger Band at 1312.07
3. Descending trendline connecting the 5/2 and 6/1 highs at approximately 1320
4. Diamond bottom target of approximately 1329


60 Min

Minor 4 Triangle


Bear Option

We remain mindful of the bear count. The triangle option for wave (4) is out. The next best explanation is a wave (4) flat. 1303 again would be the next target.

[EDIT 10:20 PM] Don't forget this five wave count down may also apply to a larger wave c of a Minor 4 flat.

6/28/11 - Pre Market [7:15 AM Update]

[7:15 AM Update]


Pre Market
ES

EUR/USD

Monday, June 27, 2011

6/27/11 - EOD Update [6:27 PM Update]

[6:27 PM Update]

Daily


EUR/USD

Triangle?

EOD Update

My primary count is that wave [d] of the triangle is in progress. The market is currently working on wave 3/c of y of [d].

60 Min

5 Min

Blue 4 cannot retrace beyond 1279.93 or the impulse count is out. However, the pullback into the close may have been wave b.

I'm still watching this diamond bottom potentially forming. The gray trendline acted as resistance but I think the market may want to challend the pink trendline there that connects the 6/1 and 6/22 high.

For balance, one more pull back may be required to form 'Low5' before breaking up and out of the diamond. We shall see shortly.

If everyone is watching the Greece situation, this may be setting up for break out once the austerity measures are approved.


Bear Option

And the bear option is working out a triangle. Let's see if it remains within the trendlines.

Sunday, June 26, 2011


Here's a follow up to my Friday Pre-Market update. Is the diamond bottom complete or will there be a lower low? Perhaps a touch of 1265, right at the lower end of the diamond trendline?

There may be some wedging down here again as well.

Friday, June 24, 2011

6/24/11 - Pre Market [5:33 AM Update]

[5:33 AM Update]


There's the pop. However, just noticed that the wedge may also represent a wave 4 so keep that in mind.

[5:15 AM Update]


Perhaps setting up for a pop into durable goods news?

Pre Market

Looks like ES pared back the overnight gains. Let's see what type of retracement occurs here.

Here's an interesting pattern I just noticed this AM. The previous two "peaks" as I have labeled were followed by a three-legged move down.

Notice the market put in a third similar peak? The rebound off the selloff does appear to be taking on a wedgish pattern too.

Shall we assume a third leg down is to repeat? Will it fall short of forming a new low since the 3rd peak formed a higher high? Is a diamond bottom forming here?

Thursday, June 23, 2011

6/23/11 - EOD Update [9:24 PM Update]

[9:24 PM Update]

Here's a 1 min view on the count. There are a few wxy alternatives as well.

I'll be keeping an eye on the 1286-1294 range.

The eur/usd looks like it may be forming a triangle. See the gold trendlines.
EOD Update

Last night I was looking for a pullback into the 1280 zone. The impulse option I presented last night is out, however, the double zigzag structure for wave [d] is still in progress. Granted today's pullback for wave x is pretty steep, however, the rules have not been violated.

It is possible that wave a of x may have been the selloff and the resulting bounce wave b. So one more leg down may be in store.

However, I'm leaning more towards the move at the end of the day as the beginning of wave y of [d].

60 Min


Minor 4


Minor 4 Triangle


Bear Option


That surely doesn't look like a complete wave (5). If so, it's truncated. And if there is more to come we may have only witnessed waves 1 and 2 of (5).


6/23/11- Pre Market Update


The market is set to gap down huge and the two options I presented last night may be taken out right away or it will be very close. Those levels again are 1279.81 and 1273.

Based on yesterday's 3 min chart this will be a gap of recognition down for that count. I mentioned that yesterday's close put wave y at 1.618*w. A 2.618* extension would put y/c at 1281.

So keep an eye on that bear count as well.

GLTA.


Wednesday, June 22, 2011

6/22/11 - EOD UPDATE

EOD UPDATE

Things are getting a little tricky here but there are still a few options for the bears and the bulls.

For the shorter term bull count, there are two levels that I'll be watching:

1. 1279.81 is the level to watch if the impulse count up is to continue. See the 10 min chart below for the count in blue.

2. If wave [d] of the triangle is in play, today marked the end of wave w or a** of [d] and the wave x or b pullback began into the close. I expect a 50% retracement for this pullback but anything greater than 62% and I'll place a lower probability to this option. See the Minor 4 Options chart for this view.

** It is also possible to incorporate the impulse count to represent wave a of [d] still in progress.

I will also be watching the trendline connecting the 5/5 - 5/17 lows for a back test target before resuming the move higher.
If either option above fails, the bear option below may be the count in play and 1248 may be in the works.

3 Min

If wave y complete today, it is 1.618*w. The channel above is an EW channel using waves 1-3. See the 10 min chart below for a larger view.

Notice that this count accommodates the wave 4 option on the 10 min chart below or the wave x/b pullback of wave [d] of the triangle.

10 Min

The blue channel is an EW based channel projecting for wave 4 using the ends of waves 1 and 3. Notice the market closed right on it today.
60 Min

Keep an eye on the red trendline and the 38-50% retracement level.

Minor 4 Options

The options are still rolling along.

Daily Bollinger Bands

Rejection at the 20 day SMA. Look at the lower band below, the market may be aiming for 1248 if the bulls don't show up.

Bear Option

A wave (5) down would match up with a target of the lower Bollinger Band.

6/22/11 - 10:26 AM Update

10:26 AM Update


Still have a very good tri potential in the works along with the alternate ED.

The initial descending tri pattern broke. We are left with the possibility of a larger flat in play for wave 4 blue or wave 3 of 5 blue is in progress.

Been meaning to post this chart. Notice the alternation in time and form?


Tuesday, June 21, 2011

6/21/11 - EOD Update [7:56 PM Update]

[7:56 PM Update]

If wave 4 blue is underway (5 min chart at EOD), a target of 1282-1285 may be in the cards for the following reasons:

1. It will be a 50% retracement of 3 blue
2. A backtest of the red descending trendline that connects the 5/5-5/17 lows.
3. The h/s target
4. The lower pink channel


I don't recall if I posted this here on the blog or in the chatroom. Anyway 1320 looks like it may have a target on it's back but we'll have to see if it provides solid resistance.


This channel is relevant and I'll be watching for a break of the descending MACD trendline to confirm a more bullish move is to come.


A closeup of the descending channel in green shows that the market climbed back over the mid channel. Target at the top is near the 50 SMA.


[4:29 PM Update]

RUT Daily


EOD Update

I'd say that was a pretty bullish day. A daily MACD buy signal occurred today. A follow through tomorrow should confirm.

The 200 day SMA proves to be a floor for now and there are counts to support them. Yesterday the 20 day SMA looked like a good target and sure enough the market headed there.

The 5 min and 60 min counts played out. I was expecting a wave 3 up and that is what the market provided.

On the 60 min below, it appears wave 3 extended a near perfect 1.618*1. So if that is the correct count, we may see some chop tomorrow for wave 4.

5 Min
It's possible wave 4 may be forming a triangle as well.

60 Min

Wave 3 right on the money with a 1.618*1 extension.

Minor 4

The triangle is still the primary with the running flat in close second. So far working on five waves up either representing wave 1/a of either [d] of the tri or wave 1 of a lower degree of Minor 5.

Bollinger Bands

Right on target as suspected yesterday.


I posted this channel a few days ago. The 200 day SMA and the mid channel support gave me a reasonable belief that a rally would ensue. Now the question is, are we in wave [d] or working on Minor 5.

Bear Count

This is still in play but I'd say weakening in it's credibility with the daily MACD turn. A daily confirmation tomorrow and this will really fall to the wayside.