Saturday, March 28, 2020

3/28/2020 - Update

The next week or two should be interesting. The SPX bounced substantially off the week's low and fell short of the 200 week moving average at the 2600 level. The bounce recovered 38% of the flush and formed a bullish engulfing weekly candlestick.

I think the bulls get at least one more push higher. This would be consistent with the alternative bear count, which has this bounce as wave a of (b) with at least a wave c of (b) higher to come.

2191.86 is the level to hold for the bulls.

SPX - Weekly

SPX - Weekly Close Up

The daily chart below. Some Fib retracement levels to keep an eye on.  Something else to consider is the expanding triangle pattern that has played out since January 2018. This would be consistent with a wave 4.

SPX- Daily


Here is a closeup view and count for the bounce

SPX - 15 Min

Thursday, March 26, 2020

3/26/2020 - AM Update

Wow. What a crazy ride. I know the bulls out there want a count and I think I have one.

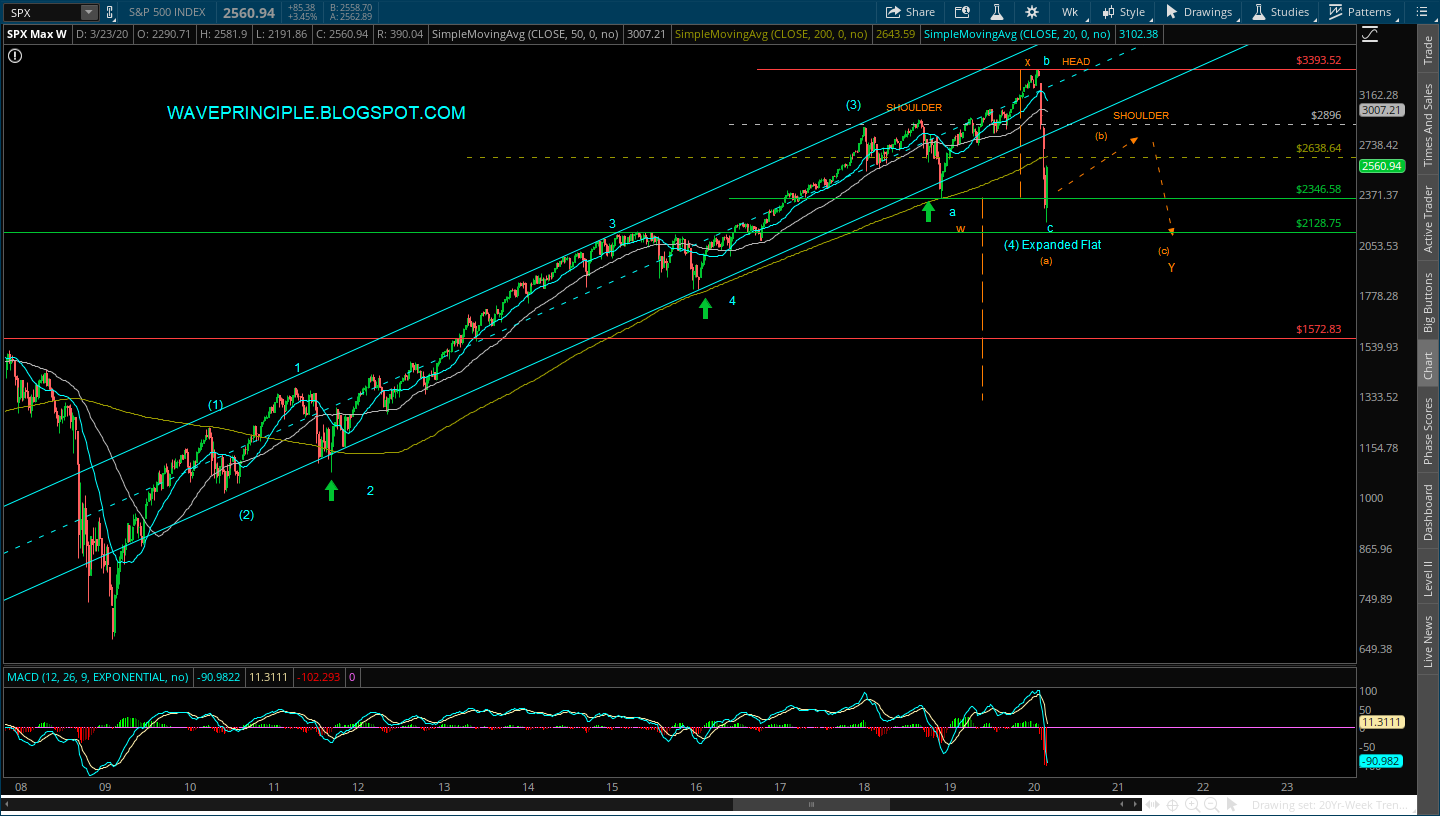
This flush that began last month is very characteristic of a wave C. As you may recall, I never liked the wave structure off last Dec 2018's low. It looks too much like a three-wave structure. Because of that I have been looking at a potential flat (previously some form of running/expanded). I think this count works and the flush is consistent with a wave C.

This count plays with a quicker recovery in the market with all the stimulus being thrown at the market and COVID-19 infection rate slowing down in the US. 

For the bears, the alternate is in orange. A larger corrective wave that could play into a head-and-shoulders pattern.

 Let's see how high this bounces first.

SPX - Weekly


Monday, March 16, 2020

3/16/2020 - EOD Update

Looks like wave a had some way to go and is now challenging the wave w low. The running flat is now in jeopardy, which may turn into an expanded flat, which means wave y will travel beyond the wave w low.

SPX - Weekly

Tuesday, March 10, 2020

3/10/2020 - EOD Update

The SPX took out the 2954 level I was watching and as previously posted the alternate count once this level was taken out is now the primary. I cannot count five waves up off the March 2009 low so the running flat/combo corrective count for wave (4) makes the most sense.

So far buyers stepped in at the lower end of the channel. We'll see if a hammer candlestick prints by the end of the week as well.

Weekly
Here is a close up of the possible corrective options that could play out if we see a battle between the bulls and bears. Wave a of Y may have completed, with wave b of Y in progress.

A running flat has wave c of Y either falling short of the wave a of Y low or lower but not below wave w.

Or wave c of Y takes on a triangle after wave b completes. Let's see what happens.

Daily