Friday, September 30, 2011

EOD Update [4:17 PM Update]

[4:17 PM Update]

I forgot to include the bigger picture for perspective.


EOD Update

Looks like the market wanted to head back to the lower end of the range to end the quarter.

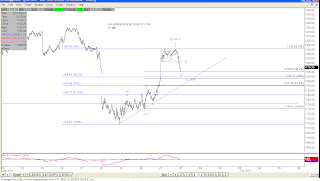
My alternate count on the 10 min that was posted yesterday appears to be the best option very near term. This most recent decline is still best counted as a corrective mess so I am assuming there will be another bounce. How high depends upon which option: blue, blue2 or red below is in play.

Range Bound
What a corrective nightmare. The most recent decline has now retraced 78.6% of the previous leg up. I believe this retracement so far is almost right on the money.

If this is going to continue in this range, a bounce here or very soon would not be unreasonable to expect. Notice that the market now has a lower high and higher low (for now) in place. This may be setting up option blue2 below.
15 Min

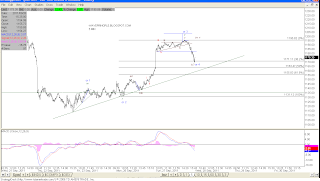
The latest drop still counts best as a corrective wave and I believe is about to complete a tiny Ending Diagonal   near the bottom here.

This either completes an Ending Diagonal or Leading Diagonal. Either one implies a large bounce should be in store. A 78.6% retracement would take the market back to approximately 1180.

Blue Count Option
This option is still very valid especially with the 78.6% retracement so far of what may be wave (x).

Blue2 Count Option
This count should also be watched since the market now has a lower high and higher lower, which implies a possible convergence.

Red Count Option
I've whittled down the red count to just one. I'm still unsure if wave ii is in progress or wave iii of the larger ED. Either way, this also requires a bounce, which most likely will be towards the upper red TL.

7:05 AM Update

7:05 AM Update

I posted this count in the chat room.  So Far it's looking pretty good.

3 Min


***  I should  add that the bounce yesterday near the close can be counted as five waves up. So watch for a 50-62% retracement near 1149-1147 first. 


6:20 AM Pre Market Update

With the opening gap drop this AM, we must turn out attention to the diagonal I presented yesterday as the alternate.

I will keeping an eye on the lower TLs. Typically in diagonals, when a wave 4 throw over occurs, it is typically followed by wave 5 throw unders. It's not a requirement but something to watch out for.

GLTA today.
10 min

Thursday, September 29, 2011

EOD Update [2:09 PM Update: Introducing Blue2]

[2:09 PM Update: Introducing Blue2]

I believe I may have introduced this option about a month ago but dropped it for the time being since it was way too early to track.

However, 1 month later, we must once again be reminded of this potential option. I bring this back since there is still no impulse wave down to begin wave C yellow and since lower highs are being made.

As far as the triangle for wave (Y)/(C) goes, it is technically still early to call but now is a good time to start thinking about it.


Blue2 Count


EOD Update

Still no signs of a larger impulse wave down. But as you can see just because a wave is corrective in nature it does not mean it is not capable of moving great distances.

Anyway. Wave (x) retraced a little deeper than anticipated but in the chat room, while analyzing the wave structure, I was able to spot a mini pattern intraday that appeared to be repeating the larger pattern yesterday.

Sure enough the market sold off further and so far found support right at the 62% retracement level of wave (w), which is a very reasonable retracement. The market then  bounced out of what may be a bullish falling wedge  at least that's what it looks like at the moment.

1162 will be the next challenge as that is the near term TL (9/27 - 9/29 high) that may provide resistance.

Notice the "ALT" labels I have placed on the chart as well? It is very possible a much larger LD may be in the works.

Though wave ALT 4 is out of the wedge, it is still considered acceptable to a degree as a throw-over. Not sure how far it can go but I'd say it would be safe to assume if price can clear the blue TL, the ALT labels can be voided.

So once again, I believe the market may be working on wave (y) up. I have provided some Fib projection targets should this be the case.

If the market is not working on wave (y), I believe a 62% retracement of the falling wedge should not be unreasonable to expect. That would place the market right around 1175.

So for tomorrow, unless the 1162 area caps the bounce, 1175 would be the first target I'll be looking for this bounce to go and then followed by 1190 (will also keep an eye on the red TL above).

Something else to keep in mind. The market has attempted to break over the 20 day SMA now. It has made three daily attempts.

Based on the wave structure/pattern (a potential bullish falling wedge) at hand and the fact that it is still just sitting below it, there may be a good chance it finally breaks over it the next day or two.

10 Min

Daily Bollinger Bands
Three attempts at the 20 day SMA. Will the 4th time break thru?

Blue Count
(y) up may have started today.
Red2 Count
Wave y gray of ii red may have started today. Note that it is very possible that wave iii may already be in progress. Today would have completed the first leg down for iii and the bounce for the 2nd leg may have begun today. So either option is looking for a bounce.

6:03 AM Pre Market Update

6:03 AM Pre Market Update

GM. ES so far has invalidated the start of an impulse wave down since what would be considered wave 4 has overlapped into wave 1. However the more bearish setup here is the nested 1-2 i-ii down.

Last night I was looking for a minimum bounce back towards 1165 (cash) or so. Looks like that objective should be met. This would make for a wave (4) that targets the level of the previous degree wave 4s. Notice the TL that may act as resistance as well on the 5 min chart below?

However, 1169.88 is the line in the sand for the impulse wave count down. If that is violated and the market so happens to rally to the underside of the TL on the "repeat?" chart below, the new red count option I posted last night becomes more credible.

Keep in mind the blue count remains valid as well and still tracks as the primary, however, the red2 count must be given some equal consideration as well as a more bearish nested 1-2 i-ii setup.

GLTA!


ES

BLUE

RED2
5 min

Repeat?

Wednesday, September 28, 2011

EOD Update [4:23 PM Update]

[4:23 PM Update]

Last Friday I posted an ending diagonal option for the red count. At the time it was a little too premature, however, this version would work beautifully. The "repeat?" chart that I posted below got me to think about this option again.

I'm still tracking the blue count option as the primary but will switch to this if the "repeat?" chart below plays out. This would make a lot of sense.

Red 2
EOD Update

Now how about that. Both moves today were exactly what I was looking for in the market. In last night's EOD Update and this morning's Pre Market Update, I was looking for a quick bounce for wave b near the 1180 area and laid out the Fibs to go with it and then a pullback for wave c somewhere near the ball park of 1163 - 1155.

Price came to a rest, for now at least, right near the 1155 mark in what counts out to be a three wave structure. As you can see in the 10 min chart below, it counts out as nice potential wxy corrective move or as in the 5 min chart an ABC.

Notice I do have  a more bearish nested 1-2 i-ii down count on the 5 min? That goes with the red option.

Obviously the corrective count option goes with the blue count option, which implies that wave (x) of (Y)/(C) is complete and wave (y) of (Y)/(C) should start with a rebound sometime tomorrow.

Tomorrow I'm looking for a minimum bounce target of approximately 1165 or so. Please see below for that reasoning.

The chart I have posted as "repeat?" is worth taking a look at should the market need one more push up but is capped near the descending red TL, which is now at approximately 1189-1186.

The next few days will be do or die for the blue count though, at least the way I currently have it labeled. I see one more potential for a deeper (x) wave but won't address it unless need be. So for now, the primary count for blue is that wave (y) of (Y)/(C) is in progress and that will be up.


10 min

5 min

Repeat?

Blue Count Option
Notice that if (x) is complete, it found support at the intersection of the channel and green TL.

Red Count Option
Red is in the process of working out wave iii red. The 5 min chart above shows the subdivision for this wave.

5:15 AM Pre Market Update

5:15 AM Pre Market Update

So far the bounce overnight in ES is confirming the b wave bounce at minimum that I posted last night . It's still possible the the late day selling completed a flat.

We'll have to see if there is any leg to this or the market may be mimicking the last leg as highlighted below. It appears that breaking 1190 will be key for cash if there is going to be further upside potential.

So to be conservative, let's watch the wave b retrace targets first, which are roughly:

1179 - 38%
1182 - 50%
1185 - 62%
ES
SPX - 60 m

Tuesday, September 27, 2011

EOD Update #2 - Five Waves Down [9/28/11 Update]

[9/28/11 Update]


Blankfiend in the comments section advised me of the issue with the DJT as I had it labeled. It was a simple fix and still applies. Thanks Blankfiend!

Original Post

** Please Note  : I do not have this count as my primary or an alternate at the moment. However, I thought  that I should explore the possibility of counting five waves down. Please see the last chart at the bottom as to why I still do not believe five waves down should be counted from the 5/2011 top.***

Now having disclosed the above, please see the charts for the SPX, DJI, DJT and RUT. If we were to assume that the wave structure off the 5/2011 high are indeed five waves down, it is very possible that those five waves have now completed.

1. Each chart below contains an EW channel that is constructed using the end points for wave 2 and 4 and drawing a parallel line off wave 3. Wave 5 typically terminates at the mid channel or at the lower end of the channel. All the indexes below have terminated at the mid channel.

2. The DJI, RUT and DJT have made lower lows, which is all that is required for wave 5s. SPX has not but truncation may be legit here.

3. Wave  5 nearly = 1 (see fib extensions)

4. I don't show it on the charts but there is a positive divergence with RSI and if MACD crosses up in the next day or two, a daily positive divergence will also result for the indexes that have made lower lows.

So what does all this imply? "If" and I mean "if" this is truly a five wave move down and "if" it is truly complete, we should expect a fairly sharp bounce that may retrace 50% of the entire 5/2011-9/22/11 decline,which is higher than what most folks may be expecting.

For the SPX that would = 1242 and 1272 if it retraces 62%. The 38% retracement is 1220. The Fib measurement is used at the orthodox wave 5 low at 1114.22 on 9/22/11.

This would still work with my blue count, which expects a larger rally to come before a new low (below 1100) is made.

Anyway, just some food for thought.

SPX


DJI

DJT

RUT


SPX

EOD Update 8:42 PM Update

8:42 PM Update

10 Min

I cleaned up this chart a little bit and plotted some Fib confluences that may be potential pullback targets if the pullback did not complete at 1175 today.

I believe a complete impulse wave down may be counted and keep in mind, it may still be part of an expanded flat and compete at 38% retracement. However, should this impulse only represent a wave a, I expect a 50% retracement of wave a for wave b near 1182 before heading down to either 1164 or 1155.


EOD Update

What a day today. Just when you thought the bulls were in control, the bears arrived to the party. The question now is will they stay or will they be squeezed out tomorrow?

Should this have been a surprise? Not necessarily. So far the target for this leg up has been met. The initial target was 1165-1175 and then adjusted to 1180. The market exceeded that today with a high of 1195 before reversing sharply the last hour of the day.

Now we must determine if this complete the first leg for wave (Y)/(C) of blue (blue option) or the more bearish wave ii gray of iii red (red option). I believe it is still possible the market pushes higher thru the end of this quarter. Please see below for those reasons.

5 Min

The 5 min chart below highlights the internal count showing possibly a wave (w) or 3 completed at the 1195 high. The pullback into the close was either the beginning of  a wave (x) or completed a flat representing all of wave iv or 4. These options apply for the blue count

A near term target for the blue count, if wave (w) or (a) is not complete yet is approximately 1204.

Blue Count


The reasons supporting the blue count:

1. VIX Equity buy signal
2. Bounced and closed above the lower trendline connecting the 8/9 and 8/22 lows.
3. Bounced at the 38% retracement  of wave 3 or (w)
4. Daily MACD looks set to issue a buy signal. (This could easily be rejected)
5. Both wave 2s for the red count are very steep retraces (approx 78.6% and more), which make that count very suspect. Not invalid, but just lower on the likelihood scale.
6. EOQ window dressing


Red Count


As for the red count, the last hour selling is the beginning of wave iii gray of iii red down.These are the reasons supporting this count.

1. The late day reversal
2. Close back below the 20 day SMA
3.

VIX Equity Buy Signal

Trading Range
I posted this simple trading range last weekend. The market just so happen to close below the mid line for the red range. Let's keep an eye and see if it manages to trade back above.

Red Range

4:45 AM Pre Market

4:45 AM Pre Market

What a rally overnight. A little over 1.5 hrs to go til the market opens but I think the 1180 target as mentioned in yesterday's EOD post is a likely target. 

ES may be confirming the blue count option and copper continues to hint at confirming my bullish longer term count. Copper is setting up to confirm the massive hammer it put in yesterday.

I'll be keeping an eye on the VIX again today. Absent a sharp reversal today, the VIX should put in a lower close from yesterday, which should be the final step in confirming the equity buy signal. This coupled with EOQ (End of Quarter) window dressing and this leg up may have some legs further confirming the blue count.
ES - 60 Min
I'd like to see it clear the upper channel of this fork. So far ES has retraced > 62% of the move recent five wave decline.
HG - Daily

HG - Closeup
The hammer confirmation is in progress. It's still up there but a rally above 3.818 and the decline off the 2/15/11 high will be deemed a three wave corrective move.

Monday, September 26, 2011

EOD Update

EOD Update

In Friday's EOD Update, I was looking for a move to 1165-1175 sometime this week or next. I wasn't looking for it to happen all in one day. Anyway, things still look good for both the blue and red counts (*red has been adjusted and thanks to Vodavi in the chat room, I have eliminated the ED option the way I had it labeled for now).

I believe there is still room for this bounce to run and possibly target the 20 day SMA near 1180. If not, as you will see below, price nearly hit the 50% retracement to a tee so if the pullback is to continue, the EW count requirements certainly have been met.

If you are watching the VIX, step 2 of the equity buy signal triggered today, that is the VIX closed back into it's BB. The final signal will be a close lower than today's close for the signal to be complete. This obviously favors the blue count.


Blue Count

Red Count

5 Min
On this chart here, there are a few options. Notice I'm leaving the 1-2 count up open as an option? I know the squiggles may not argue for it but something that must be kept in mind.

10 Min
This version of the bounce heavily favors the red count. Tomorrow's action will be telling right from the get go.


Copper Daily
The copper count still looks very good. It formed a daily hammer candle today so a confirmation will help determine if the pullback is complete.

Copper Closeup

Saturday, September 24, 2011

Weekend Thoughts [10:50 PM Update NDX]

[10:50 PM Update NDX]

Another fiver.


[3:41 PM Update Copper]

HG

I hadn't looked at copper in a while but with PMs splashed all over the headlines, I figured I take a look.

I think this is a pretty decent looking count and it wasn't a struggle to count at all. Seriously it took me literally 2 mins from the sec I pulled up this 5 year chart. The waves were so discernible and  I mean this is the type of wave structure I'm sure R.N. Elliott himself would have said, "Aha! That's an impulse wave up!".

If this is correct, this may even corroborate my bullish SPX count below.

Weekend Thoughts

Based on the charts below I'm expecting a bounce towards the 1165-1175 area over the next week or two.

The Bigger Picture
Here's the bigger picture I've been tracking for some time now. As you can see, there are several ways to count this wave structure off the 2009 low. This is why I continue to stress that for near term wave counting it is better to focus on three waves at a time, whether it be counting 1-2-3, a-b-c or w-x-y.

Until a clearly defined 4th (without overlapping into wave 1) and 5th wave are put in, anything is possible.

So why bother making a case for a super duper bearish Primary wave 3 down? For all we know it could just be a wave C or X of the same degree. Show me waves 1 and 2 or A and B down first.

Anyway back to the count at hand. At the moment I'm thinking my red count option is starting to show true potential here. As you can see below, I'm beginning to speculate a potential ED for wave C yellow.

This is early but would fit with behavior if the market is looking to find a bottom in the 1100-1000 range. Keep in mind wave C should be an impulse wave and just make five clean waves down to the levels. But again, an ED would seem more appropriate as the bulls and bears battle it out to the bottom in an overlapping fashion.
Red Count
I'm favoring this count at the moment but still watching blue for sure. Both still are expected to move in the same general directions. Its more a matter of how they do it and how high.

For the most part each count should generally keep us on the right side.
Blue Count

Trading Range
SPX remains in the 1220 - 1120 trading range. The market found support at the lower end of the range and may be setting up for a bounce as evidenced by the charts below and the counts above.
SPX - McClellan
Throughout the trading range, the market bounced to the high end of the range every time the McClellan Oscillator ticked  higher, even without diverging with price. One difference this time around though is the daily MACD sell signal, so we'll have to see if this pattern continues.
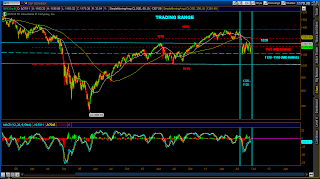
Though I haven't highlighted it on the chart, this also worked for the pullbacks as well. In fact that just occurred last week on 9/16.
NYA - McClellan
NYA, however, does show a clear positive divergence with price.
NYA - McClellan Closeup
Positive divergence on two levels so I believe the bounce for SPX to 1165-1175 is not unreasonable.