Showing posts with label EUR/USD. Show all posts

Wednesday, November 3, 2010

11/3/10 - EUR/USD


Looks like wave 4 may be complete. What a nice bounce off the MACD trendline support as well.

Thursday, October 21, 2010

10/21/10 EUR/USD Update


EUR/USD looks (it's early) like it may be moving towards forming a wave 4 triangle as well. It's starting to sport three-wave structures in addition to the fact that it is following a third wave up.

A good target is the top of the channel at 1.45. We'll see how this plays out.

Tuesday, October 19, 2010

10/19/10 - EOD Update

EOD Update

I'll post an update later but the Elliott Oscillator count I posted last night is my preferred. It fits with the 5 min count below using the alternate labels for wave [4] down at today's lows.


9:00 AM Update

9:00 AM Update - 5 Min

[4] may still be in progress with an 1156 target where y=1.618*w but that is the alternative. Let's see what this three wave move up turns into.

7:35 AM Update
7:35 AM - 60 Min Preferred

Once again, I can't stress how relevant this pink ascending trendline has been. I have my 60 min count adjusted to reflect my thoughts on the 5 min chart below.
EUR/USD


Looks like wave 4 is in progress here to, which would corroborate the SPX count. MACD trendline support may be a good target.


Pre Market


If you have been following this 5 min chart, I had an alternate count for a w-x-y in progress, which I have now labeled as the primary on the chart above. With futures currently down 8 points, a sell off for wave Y most likely will be the move for the day.

I will be keeping an eye on the Ultimate Oscillator chart I posted last night as well. That chart is also expecting a wave 4 pullback.

What I am uncertain of right now is the degree of this wave 4. On my chart above, 1174 looks to be the first target for Y.

The trendlines that I have been watching all along once again will come into play. I would reference those lines on my 60 min chart found here.

Sunday, October 17, 2010

10/17/10 - EUR/USD (With another example of a trade setup)

Edit 6:26 PM

I wrote below that a breach above wave B at 1.5141 would confirm the bullish count. It should be 1.5145.

To confirm the bearish count, a breach of 1.3334 (wave 1 of this current leg up) would be the first clue that the move up was corrective only since there would be a 4-1 wave overlap.

Monthly

Weekly
Here's a look at the EUR/USD 20 year period monthly and weekly. Longer term, it's looking really bullish.

Using the basic tenets of EW and using a very simple approach, we know that the first three waves of impulses and correctives are simply that, three waves;

1-2-3 for an impulse with a subwave sequence of 5-3-5

or

a-b-c for a corrective again with a subwave sequence of 5-3-5

Examining the count off the 2000 low through the 7/2008 top, this is a textbook 5 wave impulse up. The question becomes are we dealing with the start of a larger impulse (five waves) up or correction (three waves)?

For trading purposes, this doesn't matter as when trading waves 3s or Cs, we are trying to profit from the third wave sequence of this move whether it is a wave 3 or C.

After the 7/2008, top, we have a clearly defined three wave move down with Fibonacci retracments being met, 50% in this case, which is typical for waves 2 or B.

Looking at the monthly chart we have a positively trending MACD histogram and a buy signal right around the corner.

Apply that to the weekly chart where there is a positive MACD divergence the count looks very bullish and may support the beginning of a wave 3 or C up.

The subwaves of waves 3 or C are basically five waves; 1-2-3-4-5. Those five waves subdivides as 5-3-5-3-5.

Right now I show three waves up off the 1.1874 low on 6/6/10. I believe these are the first three waves of the 5 in the subdivision above. If this proves to be correct, we should see the remaining -3-5-3-5 sequence higher. One possible target for this first 5 is the top of the green channel.

Now for the alternate scenario. You need this to understand if your preferred count is incorrect? How will you know you are wrong unless you can identify what the other possibilities are?

Shorter term, I will know that the current count is correct if wave B (1.5141 on 11/29/09) is breached to the upside. However, if the market breaches the end of wave C (1.1874) it is possible wave 2/B is still in progress.

Keep in mind there is a possible head and shoulders formation building and wave C (the one I currently have complete at 1.1874) may extend further to achieve equality to A near 1.16 and 1.618 ratio to A near .95, which would support the head and shoulders formation. However, I'm favoring the bullish count more at the moment because of the monthly and weekly MACD.

Friday, October 8, 2010

10/8/10 - EUR/USD 20 Year


This post is for you AS Arg. Back in June I think was the first time I posted a long term count on the pair.

I have updated it here for you and cleaned it up a little. I think the count matches up with yours except for the fact that I count the c leg complete on the pullback at 1.1874.

Notice MACD on the monthly above? It looks bullish and may fit with the daily's new impulse up and push towards 1.50 or at least push wave 3/c towards 1.50.

Thursday, October 7, 2010

10/7/10 Update #2 EUR/USD - A Trade Setup Example

Update #2


Looks like wave 5 of 3/c was a clean ending diagonal. Double wedgie.

7:50 PM Update


Well what do you know another fine example of EW at work. It's almost like magic.

Wave 3/c achieved equality with 1/a, which is a common relationship found in EW and something I was expecting would likely happen given the count and the common ratio.

Check out the first post when I identified the first 5 waves. Once that had occurred, it provided one with a pretty decent setup to trade this wave 3/C.

Here's a simple explanation on the basic setup since that first post. By using basic EW analysis we know that impulse waves or corrective waves for the most part always move in at least a three wave series, either 1-2-3 (impulse) or a-b-c (corrective) . And by trading just 3s or Cs, you can increase your odds on catching that 3rd/C wave once waves 1 and 2 were identified.

In this case, once I saw 5 waves up , I knew that was either a wave 1 or wave A, and basically the first wave of a minimum 3 wave series. What would come next is either a wave 2 or wave b.

Given that we know typical wave retracements for waves 2/bbs (50-62%) , I was expecting a retracement of 1/a to approximately 50%. Once 2 / b pulled back to this area (50% in this case) and the structure looked correct, this was the signal to take a long position to ride either 3/c up. The odds were very much in one's favor at the moment.

So what happened? The EUR rallied in a wave 3/c. So now what? How long do you hold it?

Well, we know that waves 3/C are impulsive in nature, meaning they contain 5 waves within them. So what do you do? You count 5 waves up like I did.

But not only that, RN Elliott also discovered that waves extended by Fib ratios as well and equality or a 1:1 ratio was very common. So as you can see on my top chart, the Fib extension tool indicated that wave 3/C equaled 1/a at 1.40.

On my 9/22 post, I commented on this relationship and the expected target.

So here we are now. What's next?

Well given that wave 3 /C may also extend 1/a by 1.618 times, it is possible we may rally to 1.49.

So one must ask at this point, is the 5 wave structure up from 2 / b all of 3/c or is it just the first wave in a series of five waves that will eventually make up wave 3/c.

Well this structure as of now looks fairly complete and hit a perfect wave ratio. So it wouldn't hurt to take some off and wait to see what type of pullback occurs.

If this were complete, the EUR would pullback beyond 2/b and you would know that 3/c is complete because if it were only wave 1 of 3/c, a wave 2 pullback cannot pullback further than the start of wave 1.

However, if you see a pullback of 50-62% and then it bounces, odds are starting to favor that you may see another 5 wave series higher.

If you want to read up and follow along as the structure was progressing, check out the EUR/USD label.

I hope this was helpful to folks trying to learn how to trade with EW. Comments and suggestions are always welcomed.

Wednesday, October 6, 2010

10/6/10 EUR/USD


My suspicions were correct since my last post on 10/4. This was a nice looking count granted the wave 4 red out of the ending diagonal for 3 red was not as deep as I had anticipated.

Once this leg completes, we'll have to figure out if this is only wave 3 or c of a larger corrective move. Again, when I get some time, I'll post a larger view.

Monday, October 4, 2010

10/4/10 - EUR/USD


The EUR/USD may not have completed it's move yet. I still show a Fib target of 1.40 as a likely place to land, not required, but likely.

I also show wave 3 red of 3 or C blue ended with an ending diagonal but now a pullback will only be wave 4 red of 3 or C blue. See second chart.

A channel drawn using waves 1 and 3 red shows a potential wave 4 red target of approximately 1.35.

Friday, October 1, 2010

10/1/10 EUR-USD


Remember this post? It didn't fail in indicating this large move on the EUR/USD. At the time, a nice positive divergence developed and a structure that looked like 5 waves up.

What happens when you see 5 waves up? You expect three waves down which is then followed by 5 waves up. That three wave pullback retraced the initial impulse up by 50%, a very typical wave 2/b pullback.

So far, I think this current impulse is in a very extended wave 3 of 3 or C so the move up is not complete yet. I think wave 3 or C will most likely hit 1.40 wave equality with 1 or A.

No time right now but will get a SPX EOD update out later. Cheers!

Wednesday, September 22, 2010

9/22/10 (EOD UPDATE)

(EOD UPDATE) 
EOD - 5 MIN


If my 9:45 AM call is to pan out, wave (5) must be considered truncated. See below for the updated count.


EOD - 5 MIN UPDATE


I have the diagonal labeled as 5 waves down and a breakout of the diagonal as a possible double zigzag currently working on it's final wave (Y). (Y) may not hit the 78.6% retrace and only target 62%. We'll have to see.


(9:45 AM UPDATE)

9:45 AM - 5 MIN
Ok. Let's see if we can make it 2 in-a-row. This is my call for today. 

That leading diagonal is back on the table. I say we hit 1130 in either the LD or the double ZZ ([W]-[X]-[Y]). We then bounce sharply, typically 78.6% out of a LD, which backtests that lower channel. 
We fail the backtest and work our way back down in a wave 3 or C. 

If this move down was only a wave 4, then the final 5th will finally be upon us but I'm going with the LD for either a wave A or 1 down of minuette (ii).


This is gonna be my last post for the day since I have to attend several meetings. We'll see what happens at the end of the day. Good Luck!

(9:30 AM UPDATE)

9:30 AM - 5 MIN
A slight update. I just relabeled the alternate corrective count to a [W]-[X]-[Y]. Know the difference? An [A]-[B]-[C] = 5-3-5 whereas a [W]-[X]-[Y] = [5-3-5] -[a-b-c]-[5-3-5].


I'm thinking the 1130 level is going to come into play as [Y] completes there and the mid channel. We'll see. So basically, I'm saying that the odds are increasing again that this may be corrective after all.


9:30 AM - 5 MIN
Wedgie may be back on again as well.


(9:15 AM UPDATE)

9:15 AM - 5 MIN
I'm not going to post my 1 min chart but it appears at that degree, the waves since 1148.59 are very overlapping, which leads me to believe that this may be more corrective in nature rather than impulsive. 

Given that, I have added the alternate corrective labels but will still not ignore the hourly MACD sell signal. If the corrective label is correct, 1130 (green line) may provide some support and [C]=[A] right in that area.


(8:53 AM EURO UPDATE)

8:53 AM - EUR/USD
Remember this post?That proved to be telling. 

Here's an update to that count. It is in a wave 3 or C and I'm thinking it is only on wave 3 of 3 or C. 

A typical fib extension of 1/A is equality and that would place the EUR/USD near 1.40.

Once again, notice the positive MACD divergence. What does that tell me? It tells me to keep in mind that this may not just be a 3 wave corrective move up, at least not at the degree to which I have it labeled. It's telling me that we may end up seeing 5 waves up of a larger impulse or 5 waves up for just a wave A. I'll keep you posted.

(8:26 AM UPDATE)

8:26 AM - 5 MIN
The market is showing her hand a little more. I'm taking the wedge off the table. It's most likely an impulse down in the works for minuette (ii).
 

(8:00 AM UPDATE)
8:00 AM - 30 MIN

8:00 AM - 5 MIN

So far this AM the market is moving as expected. The hourly MACD is in sell mode and the lower channel (30 min) was breached.

The 5 min chart shows two potential counts. Either we are in a leading diagonal to start off minuette (ii) or this is yet another wave 4 as speculated last night (even though with low odds).

DAILY MAs


The daily MACD histograms are starting to trend lower possibly signaling a daily sell. However, my thoughts are that the green rising trendline will provide support yet again where minuette (ii) completes. If it doesn't, something else is going on.  So let's keep an eye on this.

Thursday, September 16, 2010

9/16/10- EUR/USD and SPX (12:48 AM Update)

(12:48 AM Update)

Here's that triangle I posted on earlier. Looking for a wave 5 up.

12:48 PM


Daily Preferred

The daily preferred is how the this wave iv triangle at 12:48  would fit in.


(11:43 AM)

I'm seeing a potential triangle forming again, which signifies most likely another wave 4 triangle is in play. If this turns out to be a wave 4 it would match up with my TOS chart (Daily Preferred) I posted at EOD yesterday. Will put up a chart later.

(9:41 AM Update)

So far the market broke out of the initial upper trendline I drew for that ending diagonal. As I previously posted, it was still a little too early to tell but the Ed is not out yet either.

However, what I am seeing is a buy signal on the 15 min MACD. Therefore [X] may still be in progress. We'll see.

9:05 AM
It may a little too early to call this but what I'm watching for is an ending diagonal for [Y]. So far the converging trendlines are pointing in that direction.

If this is part of minuette (ii), this may only be the first double ZZ of a larger ZZ, i.e. once [Y] completes, it would only mark a wave 'a' of (ii) and therefore imply this wave (ii) retraces more in time then price by going sideways a little more.

9:58 AM
Here's the larger view and with the positive MACD divergence. Notice as well, that 3 or C may also extend 1.618 times 1 or A.

9:40 AM
Haven't provided a count in a while but this one is shorter term but a high probability setup. It is a follow up to my last one on 8/16.

At the time I noted the positive MACD divergence and the fact that the structure off the bottom appears to be 5 waves up.

Either we are in a wave 3 or C up. Fib extension/projections are 1.34 and 1.40 based on .618 and equality to 1 or A respectively.

Thursday, July 15, 2010

SPX- EOD - FEELIN A LITTLE BULLISH? - EUR/USD RALLY!

SPX DAILY MAs

The market has now closed above the 50 day MA two days in a row. Previously it provided resistance.

The market also closed above it's downtrend line (see the bull chart) and the wave off the 1010.91 bottom looks impulsive.

If I were a overly biased bear, I'd think twice about where this market may be heading. And when I say overly biased bear, I'm referring to the ones who truly believe we will see a Primary wave 3 down.

And yes I've heard all the fundamental arguments on why the market is weak but that has been used for the past 16 months since we hit bottom in 2009. I'm not saying there are headwinds in the economy and that we couldn't test 950 again, but  I'm just saying be careful.

I've already learned that lesson since last July 2009. I personally do not feel overly enthusiastic about the economy but I'm just not too sure we see the end of the world, at least not just quite yet.


SPX 60 MIN BULL

I've changed this count and moved my alternate labels to the preferred one. I have a Minor B bottom at 1010.91. Previously I labeled that bottom as the end of minuette (a) of minute [y] of Minor B. That will now be my alternate count.

As stated above, the market broke above the downtrend line, which I have said I would like to see it do and the move off the 1010.91 low looks pretty impulsive to me. I'm looking for a minuette (v) up to complete minute [i] of Minor C of intermediate (Z) for my preferred count. See my 15 min chart below for a closer look of the structure off the 1010.91 bottom.
SPX 15 MIN

This should be self explanatory. Minuette (v) is in progress and started with at nested 1-2.
SPX 60 MIN BEAR

Here's an update to this chart. Looking for a subminuette c of (ii) to wrap up. Though I will say this count is on the brink of elimination since minuette (ii) is coming up on a 78.6% retracement of minuette (i). 

That is just a little two much to consider this count with a higher degree of probability and especially since the minute [ii] did not retrace minute [i] beyond 62%. However, this count is remains valid and as I've said before, "it is until it isn't".
 
SPX E-MINI

A clean impulse up here and it appears in afterhours, we are working on that fifth wave up.


EUR/USD

Look at that puppy rally! Pay attention to that second inverted head and shoulders I pointed out the other day.

Tuesday, July 13, 2010

SPX AM UPDATE [10:45 AM UPDATE: EUR/USD]

 [10:45 AM UPDATE: EUR/USD]
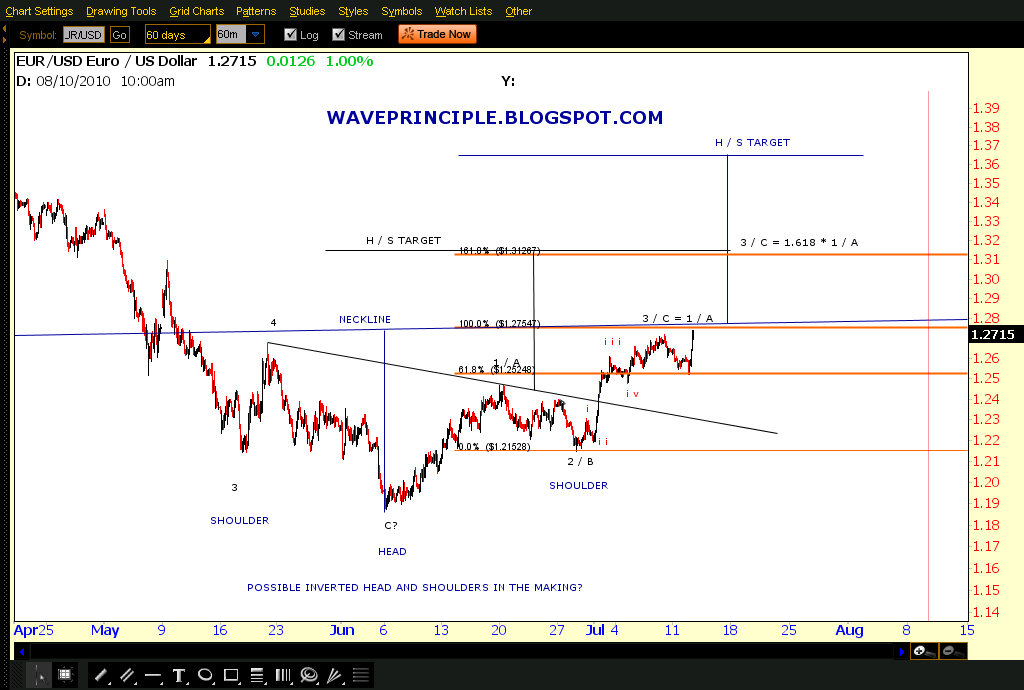
 1.27. I like it when a count comes together.

Now notice the new inverted head and shoulders that may be developing. Gonna keep an eye on this one as well. 


 ----------------------------------------------------------------------------------------------------------------------------


[10 AM UPDATE]

 SPX 15 MIN

Here's an update to this count. 


-----------------------------------------------------------------------------------------------------


I don't put up bullish counts just for fun. Gotta keep options in mind if your going to use Elliott Wave. In recent days and weeks, I have posted charts outside of Elliott Wave that should give an uber bear some pause though throughout the blogosphere, the sentiment remains very bearish other than a few bloggers, at least the ones that I'm aware of.

 Here's that channel again that I'm watching. We are over the 25% channel. If the market shot straight up to the 50% channel today, that would target 1140.

Obviously that will not happen but if the market continues to trade up in this new range between the 25 and 50% channel, we could expect a minimum of 1140 and higher.


This is the other channel based on Kazooms recommendation the other day. It's fairly the same situation, Above the 25% channel as well.

SPX DAILY BULL COUNT

Here is my old daily bull count. Haven't posted this one in a while. I made a minor adjustment and placed Minor B at the July low to reflect the alternate view on my 60 min bull count.

All along I have talked about a death cross and switching to a very bearish view if that were to happen. Of course what I wanted to see was a good impulse (5 wave structure) down along with the death cross. Though there are a few ways to count it is such since the April highs, it still remains suspect.

The bounce off 1010 is now working it's way back to challenge the 50 and 200 day MAs so we will have to see what occurs.

SPX 60 MIN BULL COUNT

Here's the latest on my bull count. A few days ago I said to watch out for the alternate count (in gray). It is still an alternate, though it is very close to becoming the preferred.

The alternate implies that Minor B was put in on 7/1 and we are now working on minuette (i) of Minor C up to new highs.

As labeled on the chart above, I'm watching that pink descending trendline. 

SPX 15 MIN BULL COUNT

 This chart is a 15 min to support the count above.


SPX DAILY MAs

Ultimately watching how the 50 day MA treats the market. We are certainly headed for it. This corresponds with the pink descending trendline above.


SPX WEEKLY BULL COUNT

I have posted this one a few times in the past and you can also view a variant of this count on my current alternate count page (see the sidebar to the right).

This should provide a view of my larger count and what I expect for a new high, if one were to be put in.

 Getting close to breaking out. This is a crucial test.


The way I approach EW is that "it is until it isn't". So unless this count to the left violates a rule, it is still very possible.

Now having posted all the above, the bear count that I have been following is still valid as well though it is losing credibility quickly. I'll update this count at EOD.

So if your trading, stay nimble and ride the waves of both the bull and bear counts. Short term both imply the same things. 

If your investing it may be better to stay flat. All I say for the investor though is don't get too caught up in the P3 hype, not yet at least. 

GL!