Showing posts with label minute [iv] flat. Show all posts

Tuesday, July 13, 2010

SPX AM UPDATE [10:45 AM UPDATE: EUR/USD]

 [10:45 AM UPDATE: EUR/USD]
 1.27. I like it when a count comes together.

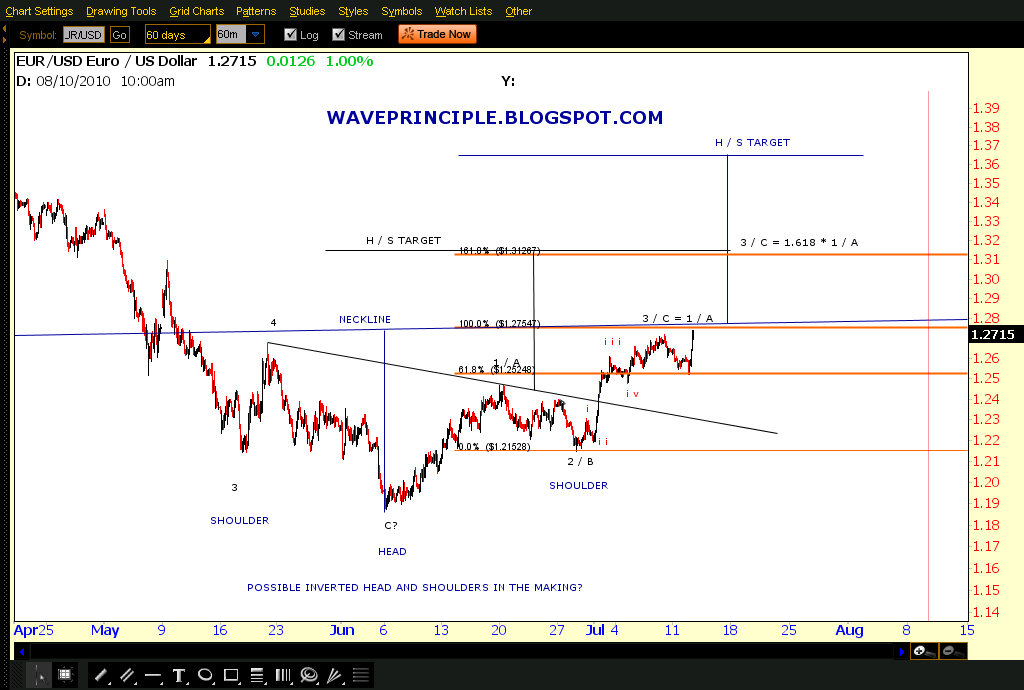
Now notice the new inverted head and shoulders that may be developing. Gonna keep an eye on this one as well. 


 ----------------------------------------------------------------------------------------------------------------------------


[10 AM UPDATE]

 SPX 15 MIN

Here's an update to this count. 


-----------------------------------------------------------------------------------------------------


I don't put up bullish counts just for fun. Gotta keep options in mind if your going to use Elliott Wave. In recent days and weeks, I have posted charts outside of Elliott Wave that should give an uber bear some pause though throughout the blogosphere, the sentiment remains very bearish other than a few bloggers, at least the ones that I'm aware of.

 Here's that channel again that I'm watching. We are over the 25% channel. If the market shot straight up to the 50% channel today, that would target 1140.

Obviously that will not happen but if the market continues to trade up in this new range between the 25 and 50% channel, we could expect a minimum of 1140 and higher.


This is the other channel based on Kazooms recommendation the other day. It's fairly the same situation, Above the 25% channel as well.

SPX DAILY BULL COUNT

Here is my old daily bull count. Haven't posted this one in a while. I made a minor adjustment and placed Minor B at the July low to reflect the alternate view on my 60 min bull count.

All along I have talked about a death cross and switching to a very bearish view if that were to happen. Of course what I wanted to see was a good impulse (5 wave structure) down along with the death cross. Though there are a few ways to count it is such since the April highs, it still remains suspect.

The bounce off 1010 is now working it's way back to challenge the 50 and 200 day MAs so we will have to see what occurs.

SPX 60 MIN BULL COUNT

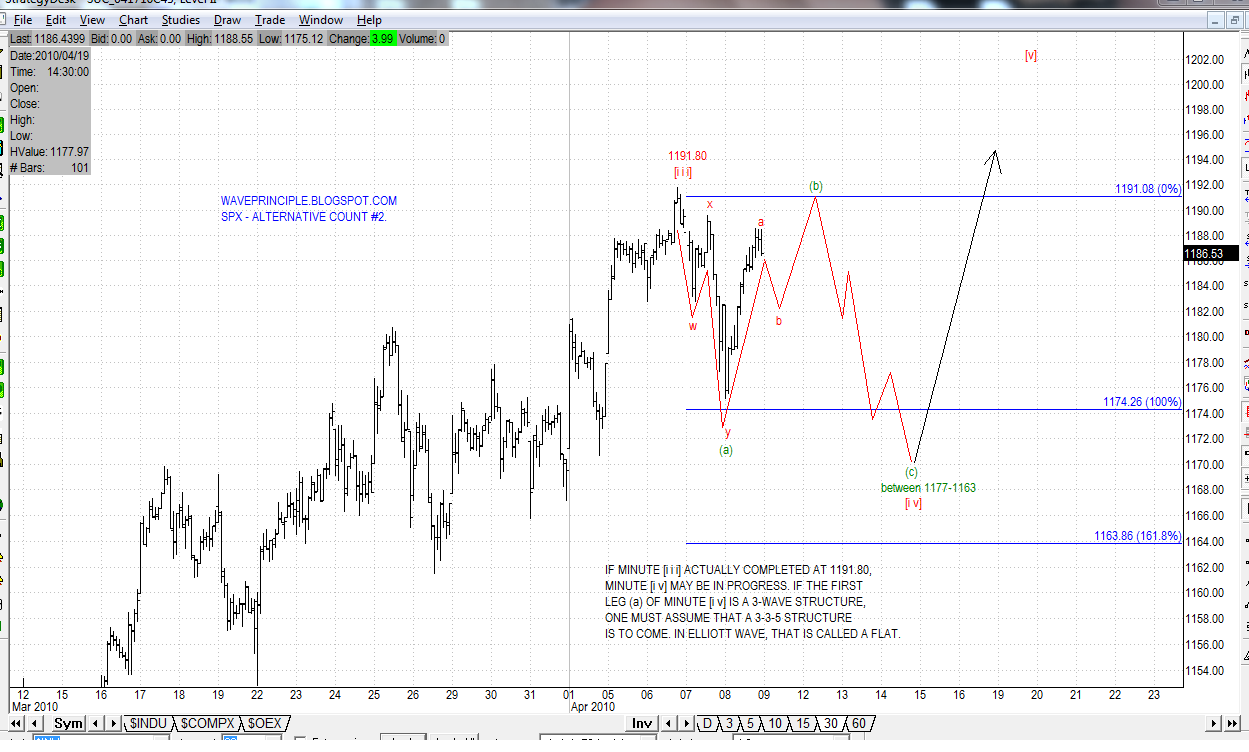
Here's the latest on my bull count. A few days ago I said to watch out for the alternate count (in gray). It is still an alternate, though it is very close to becoming the preferred.

The alternate implies that Minor B was put in on 7/1 and we are now working on minuette (i) of Minor C up to new highs.

As labeled on the chart above, I'm watching that pink descending trendline. 

SPX 15 MIN BULL COUNT

 This chart is a 15 min to support the count above.


SPX DAILY MAs

Ultimately watching how the 50 day MA treats the market. We are certainly headed for it. This corresponds with the pink descending trendline above.


SPX WEEKLY BULL COUNT

I have posted this one a few times in the past and you can also view a variant of this count on my current alternate count page (see the sidebar to the right).

This should provide a view of my larger count and what I expect for a new high, if one were to be put in.

 Getting close to breaking out. This is a crucial test.


The way I approach EW is that "it is until it isn't". So unless this count to the left violates a rule, it is still very possible.

Now having posted all the above, the bear count that I have been following is still valid as well though it is losing credibility quickly. I'll update this count at EOD.

So if your trading, stay nimble and ride the waves of both the bull and bear counts. Short term both imply the same things. 

If your investing it may be better to stay flat. All I say for the investor though is don't get too caught up in the P3 hype, not yet at least. 

GL!

Monday, June 7, 2010

SPX- AN ALTERNATIVE VIEW

SPX WEEKLY


For those who follow this blog, you have seen this count a few times now. I have it posted in my alternate count page (to the right) and also posted on it a while back here.I know it is a highly speculative count but it bears (pun intended) watching.

I know the bears have control right now but this is mainly to keep the mind open to other options out there. I would hate for other bears to become tunnel visioned to an elusive Primary wave 3 count. Though it may feel like we are on the cusp of such a wave, I still like to throw these other options out there to keep us honest.

Just looking at the first weekly chart above, wouldn't one think that the neckline of the very large inverted head and shoulders that was formed during Mar 09 provide some serious support? That looks to be at around 1000.

The bottom chart highlights a Fibonacci ratio for wave c to a, which shows that c=1.618*a. Hmmmm....

The third chart is one highlighting some Fib fans. The yellow one will be interesting to watch.

Looks like SPX e-mini is in a mini rally so far. It may be confirming by bear and bull count from my EOD post today.

BTW. I'm still waiting for that death cross to go full on bearish. So until then, more of these bullish alternates will be posted.

Let's see what tomorrow brings.

Monday, April 12, 2010

4/12/10 - Reverse Fibonacci


Here's a good example of a possible reverse fib technique in play. The leg up from (a) is now 138.2% of the previous leg down starting from 1191.80. This would make that alternate count more palatable since (b) would be a more reasonable length to (a) if this were to be an expanded flat for [iv]

Friday, April 9, 2010

4/9/10 - SPX EOD : TOP TARGET 1228-1242 [4/10/10 Update Count Adjustment]

[4/10/10 Update Count adjustment]

SPX MAIN OVERVIEW

A SIMPLIFIED LOOK (SPX 60 MINUTE)

SPX 30 MINUTE

Back in early March, I addressed a count in the chart above, which I have labeled as the alternate in gray. See post here. Somewhere along the way I abandoned the count, but frankly I think should be the preferred. However, at the moment both work and require a very similar 5 wave structure to complete so I won't relabel my counts. 

These two counts I believe are nearing completion. Both require a final wave "C"; the preferred a Minor C and the alternate a minuette (c)

Though both are different in terms of degree, they both require a 5 wave impulsive structure. That should be a little easier to identify than a corrective mess. 

On my preferred count, minuettes (i) and (ii) are complete and we are working on a (iii). Of that (iii), subminuette i I believe is about to complete. A quick subminuette ii down should form before a iii of (iii) higher.  Refer to the 30 minute chart above for the details to this count.

For both counts, I'm looking at a potential target at the 1220 level (and possibly more as the title suggests). The 60 min chart shows where I placed the label for minute [v] at the mid channel, however, the structure may also target the upper channel line. 

Notice the gray Fibs on the 60 minute chart. It represents (a) of [y]. (c) of [y] gray = .618(a) of [y] at approx 1220.  So both counts are leading us to the same targets.

The later part of this post below provides additional reasons for the target levels.
-----------------------------------------------------------------------------------------------------------


SPX PREFERRED COUNT DAILY CHART


SPX PREFERRED COUNT 30 MINUTE CHART

Looks like we made a new high today. Aside from shifting some of my alternate counts around (I know there are a few), my main count has remained consistent for quite some time now.

In summary, I have us working on the final stages of Minor C of (Z) targeting 1228-1242. Channels, trendlines, resistance areas are guiding price in this direction. 

Other reasons for this are:
1. Long term head and shoulders target (purple)
2. 61.8% retracement of the 2007-2009 bear decline
3. Minor C of (Z) = 1.618*Minor A of (Z)
4. Minute [v] of Minor C = minute [i] of Minor C

At this point, I won't call this the top of P2. I will say it may be a significant top that may lead to either a drastic pullback towards 1000 or a temporary pullback before reaching the 1228-1242 level. 

Near term, I believe we will break 1200 and initially target 1205-1215.  The triangle thrust target shows us near 1205. There is another inverted head and shoulders pattern developing. I mentioned this earlier today in the CiL. The target for this pattern is approximately 1215. See the 30 min chart above.

As my alternate counts and options show, the following are the potential market "top" choices:

1. (Z) of P2
2. Minor A of (Z)
3. Minute [iii] of A/C of (Z)

SPY ENDING DIAGONAL ALTERNATE COUNT

 The chart depicting the SPY in an Ending Diagonal is an option as well as it relates to the top charts.

SPX ALTERNATE COUNT #1 DAILY CHART

Should the top options fail, alternate#1 is my top choice. This would most certainly fit the price structure into the large wedge. We'll keep an eye on this one if price does not puncture the lower ascending wedge line. 

SPX ALTERNATE COUNT #2

As for alternate#2, please read last night's post for an explanation. If this option plays out, we should expect an expanded flat for minute [iv].

Thursday, April 8, 2010

4/8/10 - SPX ALTERNATIVE COUNT #2


CLOSEUP

Figure 1-29 and 1-30
Courtesy of Elliott Wave International

Who says you can't use Elliott Wave to forecast. This just might be one example using the alternate count #2 that I have for the SPX. 

In this alternate count, I have presumed that minute [iii] topped at 1191.80. What has followed the top is a clear 3-wave corrective structure. 

Per Elliott Wave Principle,  there are two  main corrective structures; 5-3-5 (ZigZag) and 3-3-5 (Flat).(***For this example only since the third  is a triangle but that is not in play at the moment. More on that below***)

Since it is a clear 3-wave structure off 1191.80, the presumption is that a flat corrective is in progress. Since we know that flats consists of 3-3-5 wave structures and the first 3 has completed, we should expect a second set of a 3-wave structure up as I have highlighted in red in the closeup chart.

We will know very shortly if this is the case. As I have labeled on the closeup chart, wave a of (b) is complete or nearly complete. A pullback in the form of wave b would be expected before a final wave c up to complete (b)

The (b) wave in flats typically retrace (a) approximately 90%.  If we see this occur and then price reverses down, that will be another strong tell that this is a flat corrective. One additional caveat to this is the expanded flat. I won't go into details about that unless I see it happen. But just remember that I mentioned it here.

 ** As mentioned above, a triangle is another corrective structure that consists of five 3-wave structures as depicted in the figure below:


Courtesy of Elliott Wave International

I won't address this yet but I will certainly keep it in mind if we begin to see multiple 3-wave structures converging.

And guess what, if we end up seeing a flat or triangle develop, this implies that a final minute [v] is most likely to come with new highs to come.

Stay tuned!