
CLOSEUP

Figure 1-29 and 1-30
Courtesy of Elliott Wave International
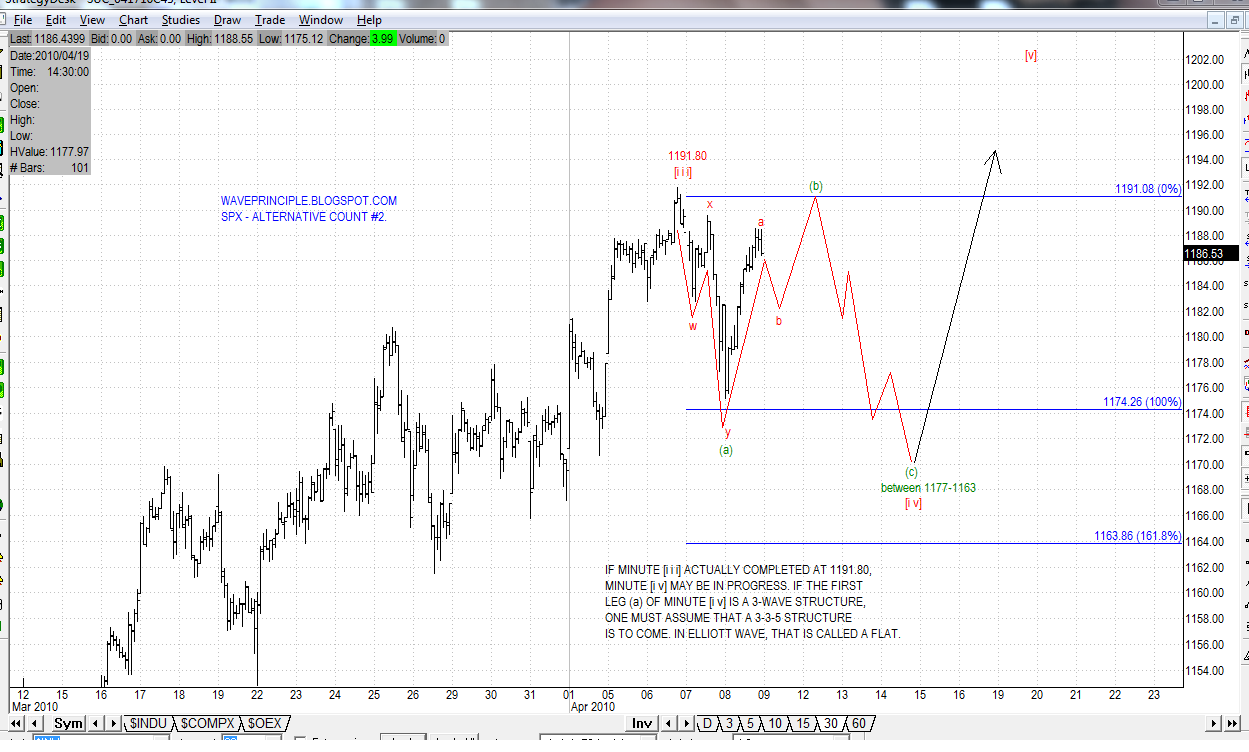
Who says you can't use Elliott Wave to forecast. This just might be one example using the alternate count #2 that I have for the SPX.
In this alternate count, I have presumed that minute [iii] topped at 1191.80. What has followed the top is a clear 3-wave corrective structure.
Per Elliott Wave Principle, there are two main corrective structures; 5-3-5 (ZigZag) and 3-3-5 (Flat).(***For this example only since the third is a triangle but that is not in play at the moment. More on that below***)
Since it is a clear 3-wave structure off 1191.80, the presumption is that a flat corrective is in progress. Since we know that flats consists of 3-3-5 wave structures and the first 3 has completed, we should expect a second set of a 3-wave structure up as I have highlighted in red in the closeup chart.
We will know very shortly if this is the case. As I have labeled on the closeup chart, wave a of (b) is complete or nearly complete. A pullback in the form of wave b would be expected before a final wave c up to complete (b).
The (b) wave in flats typically retrace (a) approximately 90%. If we see this occur and then price reverses down, that will be another strong tell that this is a flat corrective. One additional caveat to this is the expanded flat. I won't go into details about that unless I see it happen. But just remember that I mentioned it here.
** As mentioned above, a triangle is another corrective structure that consists of five 3-wave structures as depicted in the figure below:
Courtesy of Elliott Wave International
I won't address this yet but I will certainly keep it in mind if we begin to see multiple 3-wave structures converging.
And guess what, if we end up seeing a flat or triangle develop, this implies that a final minute [v] is most likely to come with new highs to come.
Stay tuned!