Showing posts with label SPX Trendline. Show all posts

Saturday, December 3, 2011

Weekend Thoughts

The market bounced at the mid channel and a daily MACD buy signal confirmed to boot. The first challenge will be the red descending trendline, which is currently near 1320.

3 Push


If you are a long time reader, you have seen this chart before. I  posted this for the first time here and periodically updated it over the months.

I just stumbled upon this again and noticed that this may be repeating for the 4th time. Will it? Who knows. It surely did three times after contemplating this the first time around.


Notice that after crossing the yellow horizontal resistance levels, the market cleared their respective descending trendlines in yellow, green and red?

If this is going to repeat for a 4th time, SPX will have to clear 1292 (current yellow horizontal resistance level)  and then the grey descending trendline at approximately 1340.

One very noticeable difference this time is where T3 of the MACD  hit. It dropped well below the trendline whereas in previous instances it found support at the trendline.

If you are interested in reading about the progress of this chart since the first post, click on the "SPX Trendline" link or label at the bottom of this post or to the right of the blog.

Wednesday, December 22, 2010

12/22/10 - [11:25 AM Update]

[11:25 AM Update]


[9:50 AM Update]
5th Wave Extension

I think this is a very good scenario playing out. See this previous post on the Golden Section to understand what the above chart implies.

If a 5th wave extension is occurring, 1293 looks like a good target. This also fits in with my reverse fib technique/confluence chart. See here for that chart

Pre Market

/ES

No counts for e-mini just a simple channel and a range is highlighted.

I believe this may have been the first time I posted this chart back in July. If you have been reading this blog for some time, you may have already seen this chart. I hadn't taken a look at it in a while until this am. Below is the most current update.

SPX

Whether or not there was any merit to the comparison, it surely panned out.

If your interested in seeing the progression of this chart, check it out here here.

I bring it back because this is an example of what I deem "outside the box" thinking. Or maybe it's just a form of pattern analysis.

Call it what you will but maybe it's relevant because I continue to see comments on blogs about how manipulated the markets are or how such and such indicator is not working, or EW is worthless, blah blah blah...

I bring this up because, maybe one should give some consideration to how popular a TA tool is and treat it with a contrarian view; meaning, if everyone is talking about it and referencing it, maybe it is no longer useful. Isn't that an argument of those who do not believe in TA, the fact that it is a self-fulfilling exercise?

Anyway, all I'm saying is, if something isn't working, rather than moan and groan about something not working, maybe we should look for another solution or a another way of analyzing the market that perhaps the majority of folks aren't doing.

Just my humble 2 cents.

Wednesday, September 15, 2010

9/15/10 - EOD (1150 Anyone?)

Daily Preferred
I like the way this count looks on TOS. This is what I'm going with for now. Keep in mind it is also possible to count the rally complete and as initially posted this AM, I had considered a minuette (ii) ZZ down in progress.

15 MIN
Here's a look at the 15 min with the alternate label for minuette (ii) down. Today's push higher may still be an X wave for the double ZZ for minuette (ii). However, notice I also have wave [4] possibly ending at today's low.


I continue to post this chart because I think this is what is playing out. 1131 is the level everyone is watching and it makes sense. Notice the descending MACD trendline (red). A break above 1131 will most likely break above this trendline as well.

Revers Fibonacci Confluence
Here's a technique I have posted on in the past. (See Reverse Fibonacci). Using this technique we see a confluence at 1112 and 1150.

Sunday, August 15, 2010

8/15/10


We already know what our bearish options are. Here is the bullish option to think about.


Here's an update to this chart I've been tracking. Looking for T3 (trough #3 to pull back a Fib level before continuing it's march higher). A possible target would be at MACD trendline support.

Tuesday, August 10, 2010

9/10/10 - 12:30 PM Update


I didn't post anything last night because there wasn't anything worth pointing out. Today may be the day, however, in determining where we go.

As of this writing, the e-mini is down 10 pts and testing the lower ascending trendline. I have posted the above chart a few times now and noticed that prior to the breakout after P5, we saw a little dip, I have labeled as T1. That low was put in on 7/8/09 and retraced the 666 low to peak just over 23.6%.

So if we see a repeat in this pattern we may see a pullback to the 1090-1080 of the most recent rise off the 7/1/10 bottom.

But of course the flip side to that is the market reacts positively to the Fed meeting and breaks out above the inverted head and shoulders.

6:45 AM Update
And this is how it may be playing out with the optional count I have posted previously. Notice the alternate labels in gray. Retracement targets are the same as above. We'll see...

10:30 AM Update
 The Daily MACD is looking a little bearish. This diagonal (ending/leading) may be coming to an end. We are under the 200 SMA. The 50 sits at 1087. Hmmm..Maybe consistent with the first chart above.

 Many ways to look at it.

Weekly Bullish Option
Here's an update to another way I have counted these waves up. More importantly though for the moment, look at the MACD. The last few times I pointed this out, the Histograms continued to trend positive.

Should the market close green this week, I believe the weekly cross and centerline crossover will occur.

SPX - 60 MIN BEAR
 Did ya think I forgot all about my bear count? Here it is for good measure.

Friday, August 6, 2010


Does the market repeat 8/09 - 1/09 and stair steps higher?

Wednesday, August 4, 2010

SPX - EOD - 8/4/10 [Updated: Oct 2007 Revisited]

SPX - Daily MAs
No changes on the count. The 13,21 and 34 EMAs are racing towards the 200 SMA at a pretty steep angle. The 50 SMA is clearly starting to turn up now as well.

I would imagine any sort of sell off in the coming days, if there is one, will find support at anyone of these MAs. The last test was on 7/30 at the

I'm highlighting this inverted head and shoulders once again. So far it looks good to me.

We back tested the neckline yesterday and picked up a little bounce today.The approximate target is 1230.

The major caveat to this is the lack of volume on the neckline break so we'll just have to keep monitoring this one.What may offset this is the weekly MACD indicator as posted here last night.

No real time today. I may add charts later.


Oct 2007 High
So I found a little more time. Remember this chart (See here for prior post)? At the time, I speculated that we were potentially repeating the Jul - Oct 07 period, which would correspond with my preferred daily view.

Since the current death cross, the comparison changed, however, I think seasonality may come into play once again.

I was reminded of this chart after reading Mark Hulbert's "No Time Like the Present". Notice back in July 07 the market found a bottom before posting a new high in Aug? Now look at the chart below.


8/4/10
On the current day chart to the left, it appears we may have found a bottom again in Jul and here we are again in Aug.

Notice how similar the structure is starting to look compared to the above? So do we play the odds?


I will continue to post this chart as the market progresses higher. Getting close to breaking out of the horizontal trendline.

Monday, August 2, 2010

SPX - AM [Updated with MACD Centerline Crossover]

SPX - 30 MIN - 7:25 AM
SPX - 30 MIN

I switched to a 30 min view since I'm running out of run on the 15 min. As posted last Friday, I was expecting the beginning of a third wave up and so far the market is not disappointing.


SPX - DAILY MAs


We are 5 points over the 200 daily SMA and now upon the neckline of an inverted head and shoulders that I have talked about. The target for this inverted h/s is approximately 1240.

The 13, 21 and 34 EMAs are all above the 50 SMA, which has started to turn back up towards the 200 SMA.


I still love this channel. As previously mentioned, the market bounced off the 25% channel and now looks clearly headed for the 50% channel at a minimum of 1150.


Remember this chart? I've posted this one a few times now too. That desceding trendline (red) is the neckline of the bigger fractal possibly playing out.

Keep in mind though, the larger fractal may be missing one more leg down, which in order to work, will require a lower low than 666.

I'll have to play with the charts to ensure that is what may be playing out.

SPX - Weekly Bull
Lastly, another chart I have posted several times now to keep the bears in check.

Not saying this is the right count but nothing wrong with it. Notice the ascending trendline support?


SPX - Daily MACD Centerline Crossovers
Here's an update to this chart I posted here. Again, just an observation at the time but look at the nice little backtest of the orange descending trendline.

If history repeats, we're looking at a 100 pt move, which is consistent with everything else I have presented. We'll see...


Friday, July 23, 2010

MACD - CENTERLINE CROSSOVERS, CONTINUATION PATTERN AND A BULL FLAG [7/25 UPDATE]

[7/25 UPDATE]

SPX INVERTED HEAD AND SHOULDERS


Don't the two structures/patterns on the chart look pretty similar? Both sport positive MACD divergences as well. 

The second pattern may have already broken through it's neckline but I would say the 200 SMA would be a better gauge. 

On the chart, the labels P1-5 represent the peaks for each structure. They are labeled according to their similarity to one another.  

Obviously this has nothing to do with EW but just about pattern analysis.


--------------------------------------------------------------------------------------------------------------------------------

SPX DAILY CENTERLINE CROSSOVERS

This is just an observation that may or may not be helpful. Since the March 2009 bottom, there have only been 5 daily MACD centerline crossovers, including one today.

Following those crossovers, I have highlighted the resulting closing highs and the associated point gains since those crossovers.

All the other crossovers since today have come from very shallow crossunders except for the March 2009 low. Notice that the latest crossover started from a deeper -30 reading almost similar to 2009. More importantly the signal line turned and formed a positive divergence not seen at any other time.

These should be consider a strong bullish MACD signal. Couple that with the bull counts (and all the other alternatives) that I have presented and this would make the case for some further gains to the upside.

Here's a follow up to this chart I posted on July 7. Looks like we may have a break to the upside.


TRANS BULL FLAG

I posted this one a few days ago as well. Looks like it broke out of the flag.


Of the blogs that I read, many of the blog's viewers are still very bearish in my opinion. Many still hope and cheer for a market crash that might not ever come. I'll give it up to them for their perserverance but will continue to treat it as a contrarian indicator.

Tuesday, July 13, 2010

SPX - EOD [E-MINI UPDATE]

[E-MINI UPDATE]
I like how the E-mini counts as it relates to my bull cash count.
----------------------------------------------------------------

SPX DAILY MAs

So close to the 1100 level and it looks like we had a third kiss of the 50 day MA.

 The market briefly crossed over the descending trendline but closed below it along with the 50 day MA.

No signs of weakening yet of the daily MACD histograms but I wouldn't be surprised if we saw a pullback soon, but then again, my 15 min count shows us possibly in a wave [4] (micro).


SPX 15 MIN

Given the run we have had the past several days, a play on a pullback with a clearly defined stop (trend line or 200 MA) may not be a bad way to go.

However, I do not have it labeled on the chart to the left but there is a possibility we are only on a 3rd of a 3rd wave up.

We are only in day 2 into earnings season so far the market has reacted favorably. It got me thinking,  what would happen to sentiment if BP is successful in their attempt to cap/control this gusher.

E-Mini

As I posted the other night, the mini looks like it has a very clean impulse off the bottom without any truncation issues.

With the after hours rally into INTC's news, it appears a 5th wave up is in progress, with the chance that this too may only be the top of 3. It is fast approaching an old resistance level.


DOW DAILY

The DOW closed above it's 50 day MA and the descending trendline of Apr - Jun.


SPX - CHANNEL

Still working it's way up the channel.

SPX AM UPDATE [10:45 AM UPDATE: EUR/USD]

 [10:45 AM UPDATE: EUR/USD]
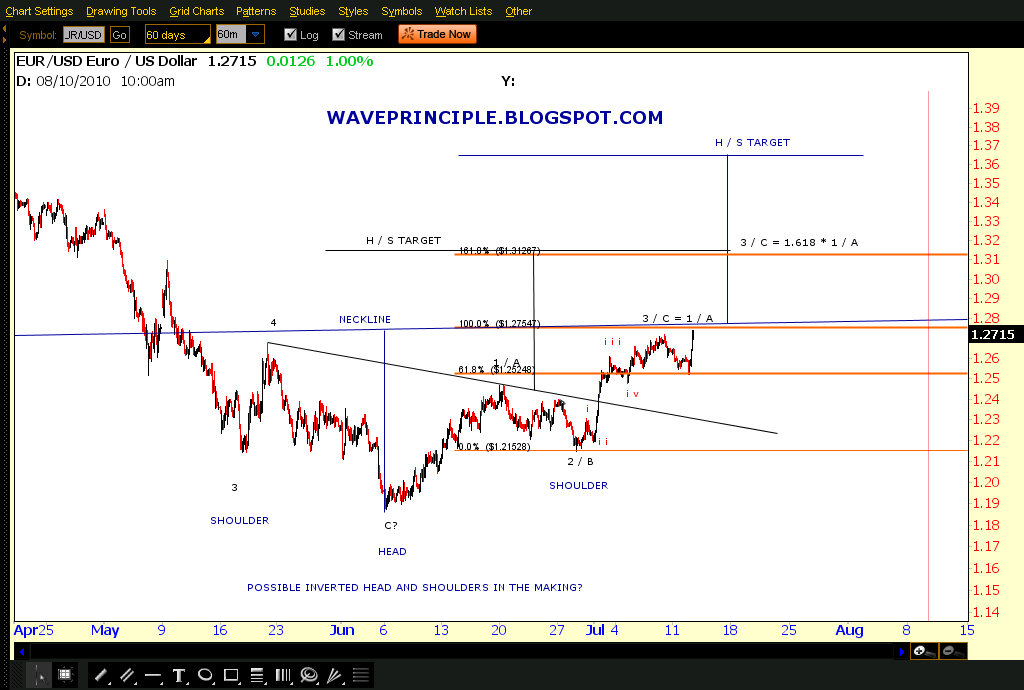
 1.27. I like it when a count comes together.

Now notice the new inverted head and shoulders that may be developing. Gonna keep an eye on this one as well. 


 ----------------------------------------------------------------------------------------------------------------------------


[10 AM UPDATE]

 SPX 15 MIN

Here's an update to this count. 


-----------------------------------------------------------------------------------------------------


I don't put up bullish counts just for fun. Gotta keep options in mind if your going to use Elliott Wave. In recent days and weeks, I have posted charts outside of Elliott Wave that should give an uber bear some pause though throughout the blogosphere, the sentiment remains very bearish other than a few bloggers, at least the ones that I'm aware of.

 Here's that channel again that I'm watching. We are over the 25% channel. If the market shot straight up to the 50% channel today, that would target 1140.

Obviously that will not happen but if the market continues to trade up in this new range between the 25 and 50% channel, we could expect a minimum of 1140 and higher.


This is the other channel based on Kazooms recommendation the other day. It's fairly the same situation, Above the 25% channel as well.

SPX DAILY BULL COUNT

Here is my old daily bull count. Haven't posted this one in a while. I made a minor adjustment and placed Minor B at the July low to reflect the alternate view on my 60 min bull count.

All along I have talked about a death cross and switching to a very bearish view if that were to happen. Of course what I wanted to see was a good impulse (5 wave structure) down along with the death cross. Though there are a few ways to count it is such since the April highs, it still remains suspect.

The bounce off 1010 is now working it's way back to challenge the 50 and 200 day MAs so we will have to see what occurs.

SPX 60 MIN BULL COUNT

Here's the latest on my bull count. A few days ago I said to watch out for the alternate count (in gray). It is still an alternate, though it is very close to becoming the preferred.

The alternate implies that Minor B was put in on 7/1 and we are now working on minuette (i) of Minor C up to new highs.

As labeled on the chart above, I'm watching that pink descending trendline. 

SPX 15 MIN BULL COUNT

 This chart is a 15 min to support the count above.


SPX DAILY MAs

Ultimately watching how the 50 day MA treats the market. We are certainly headed for it. This corresponds with the pink descending trendline above.


SPX WEEKLY BULL COUNT

I have posted this one a few times in the past and you can also view a variant of this count on my current alternate count page (see the sidebar to the right).

This should provide a view of my larger count and what I expect for a new high, if one were to be put in.

 Getting close to breaking out. This is a crucial test.


The way I approach EW is that "it is until it isn't". So unless this count to the left violates a rule, it is still very possible.

Now having posted all the above, the bear count that I have been following is still valid as well though it is losing credibility quickly. I'll update this count at EOD.

So if your trading, stay nimble and ride the waves of both the bull and bear counts. Short term both imply the same things. 

If your investing it may be better to stay flat. All I say for the investor though is don't get too caught up in the P3 hype, not yet at least. 

GL!