[8:48 AM Update: See bottom chart]
I have moved the Minor 5 count to the primary here due to the extreme rally we have witnessed over the past 5 days. The daily MACD is on a vertical ascent ready to cross up through the zero-line. The momentum on this cannot be ignored.
The minor 4 triangle, which has been my primary for several weeks, certainly is not ruled out yet but it has now become the alternate count.

MINOR 5
I have adjusted the labels for the count above to highlight the new primary count. As I have presented before, the time ratio above for Minor 4 was nearly 2x Minor 1. For now Minor 4 is considered to be a running flat.


Note the MACD though.

Wave 3 (unsure of degree at the moment) of Minor 5 is complete or very near complete. I think if it wants to extend a little more, 1345 looks like a good target for the following reasons:
1. Represents the 78.6% Fib retracement from the 1370 high to 1260 low.
2. Wave 3 = 2*1
3. The 2/28 and 5/31 swing high at 1344, which also sets up a potentially bearish right shoulder of a head and shoulders pattern ***
*** This level must not be ignored either for it's bearish potential.

SPX WEEKLY
Here's a weekly chart I posted in the chat room on Friday. This obviously assumes if the count is correct as it relates to the impulse labels. There's an interesting Fib confluence using the lengths of waves 1 and 3.
Since wave 3 is shorter than wave 1, wave 5 cannot exceed wave 3. The blue Fibs represent the max length of wave 5.
Taking the length of wave 1 and projecting from the end of Wave 4, we can see what targets Wave 5 may hit based on the typical Fib relationships. One such relationship is .618. Notice the confluence of that length and the max length based on wave 3? 1580-90.
Though the 1450 level does not contain typical Fib targets, we must not ignore the confluence here as well.
Note I didn't explore the Fib relationships as it pertains to the corrective label options. Didn't have time at the moment.
Anyway, this is something to consider.

BEARISH HEAD AND SHOULDERS
Note the MACD though.

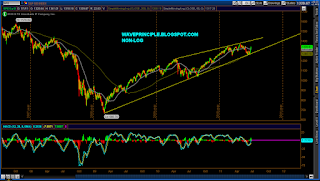
Updated 8:48 AM - LOG Scale
I forgot to post this chart earlier. The chart is log scale. Price closed just above the lower trendline. Will have to see if it holds, which at the moment, I would have to think it does given the momentum. However, we shall see over the next week or two while keeping the potential bearish head and shoulders in mind.
But look at the non-log scale chart below. A perfect kiss at the lower trendline before the bounce.