Ok. I know all my charts can become confusing. Bottom line is the blue count below is the primary. Within this primary, we are trying to figure out the count for wave (a) or (w) of (Y).
Below I have two 5 min charts that I believe are pretty good counts. And yes I have brought the ED back.
Pay attention to the red TL there two connecting the 7/18/11 low and 8/31/11 high.
So my call for tomorrow, should this wave NOT extend, is that the leg ends somewhere between 1211 - 1215.

 |
| Impulse option for (a) of (Y) |
 |
| Corrective option foe (w) of (Y) |
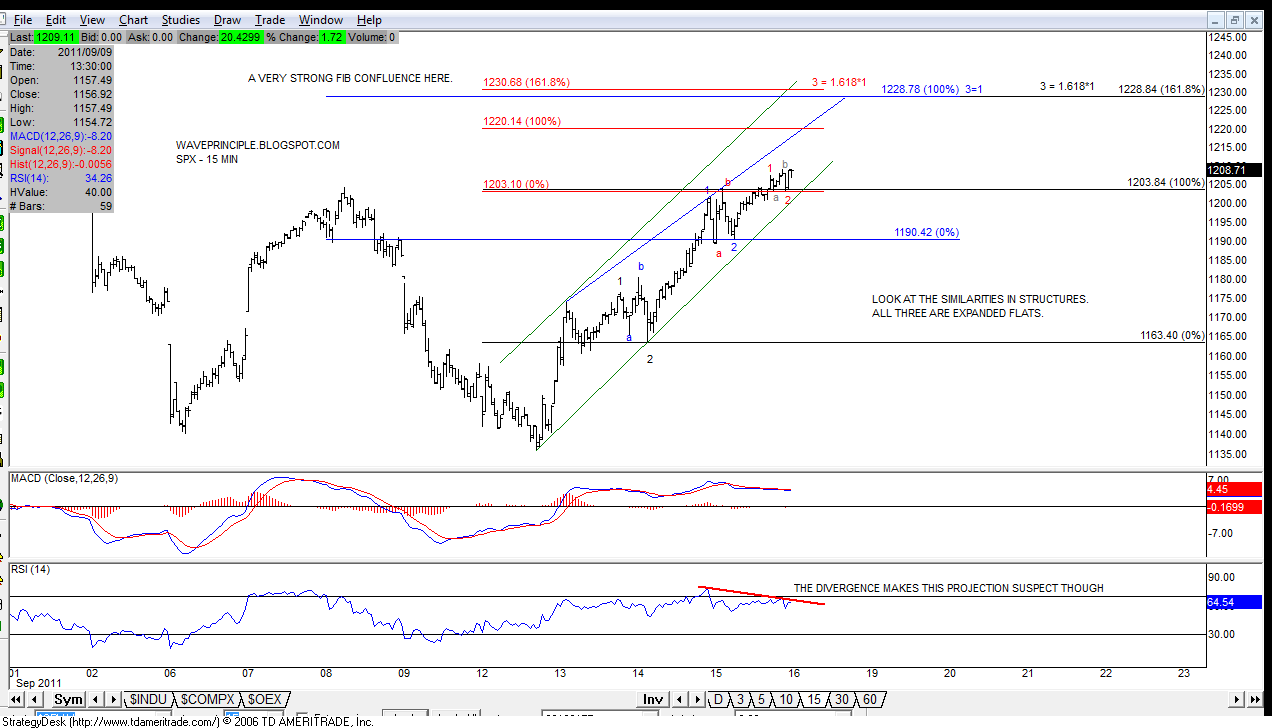 |
| SPX - 15 Min |
While staring at the wave iii extension chart I posted earlier, I noticed the triple expanded flat structures (more interesting than anything but possibly confirming the extension) and more importantly the heavy Fib extension clusters at 1228-1230.
Notice that each respective wave three extends their wave 1s right at that key level. I do note the -ve RSI divergence as well as MACD so we shall see.
2:10 PM EOD Update
Four green days in a row. 6/27/11 was the last time the market rallied like this and that was five days in a row. Of course that was just before the July swoon.
 |
| 5 min |
The market rallied and stalled just under the TL. For now I have labeled the structure as complete, however, should that last push into the close require some more upside, I'm capping it near 1211. Why 1211? See the 80 week SMA down below.
1215 makes v=.618*i so something else to keep in mind.
 |
| Collective Count |
1230.71 is key to ruling out the red count and most like the green count, at least the way it is labeled now. A break above this level turns the purple count into an expanded flat wave (X).
 |
| Blue Count |
This count remains the primary and I'm feeling fairly confident about this count due to the price movement over the past four days.
I have noted on the charts some things I'm watching for on this count.
1. A possible wave iii extension that heads straight for 1228-1230. I mention this possibility when I was counting the ED on the 5 min chart above. I mentioned, in the chatroom that if the ED did not breakdown, the wave iii extension becomes a very high probability event. We'll see tomorrow.
2. I clarify the (W)/(A)- (X)/(B) - (Y)-(C) labels for wave B yellow should this rally from the 9/12 low extend and form one large impulsive wave. If it does, the (A)-(B)-(C) count becomes the more appropriate label and implies that wave A yellow completed at the 8/22 low.
 |
| Green Count |
I still like this count especially how it plays into the converging trendlines. Should wave d be complete, which seems like a logical place to stop per the 7/18 low - 8/31 high TL and the 80 week SMA, I'm looking for a wave e low near 1160 and maybe less.
 |
| 80 week SMA |
 |
| 7/18 - Low - 8/31 High |
 |
| Bullish wave iii extension |
 |
| Weekly |