 |
| 60 Min |
Wednesday, October 31, 2012
10/31/12 - EOD Update
Tuesday, October 30, 2012

Thursday, October 25, 2012
10/25/12 - EOD Update
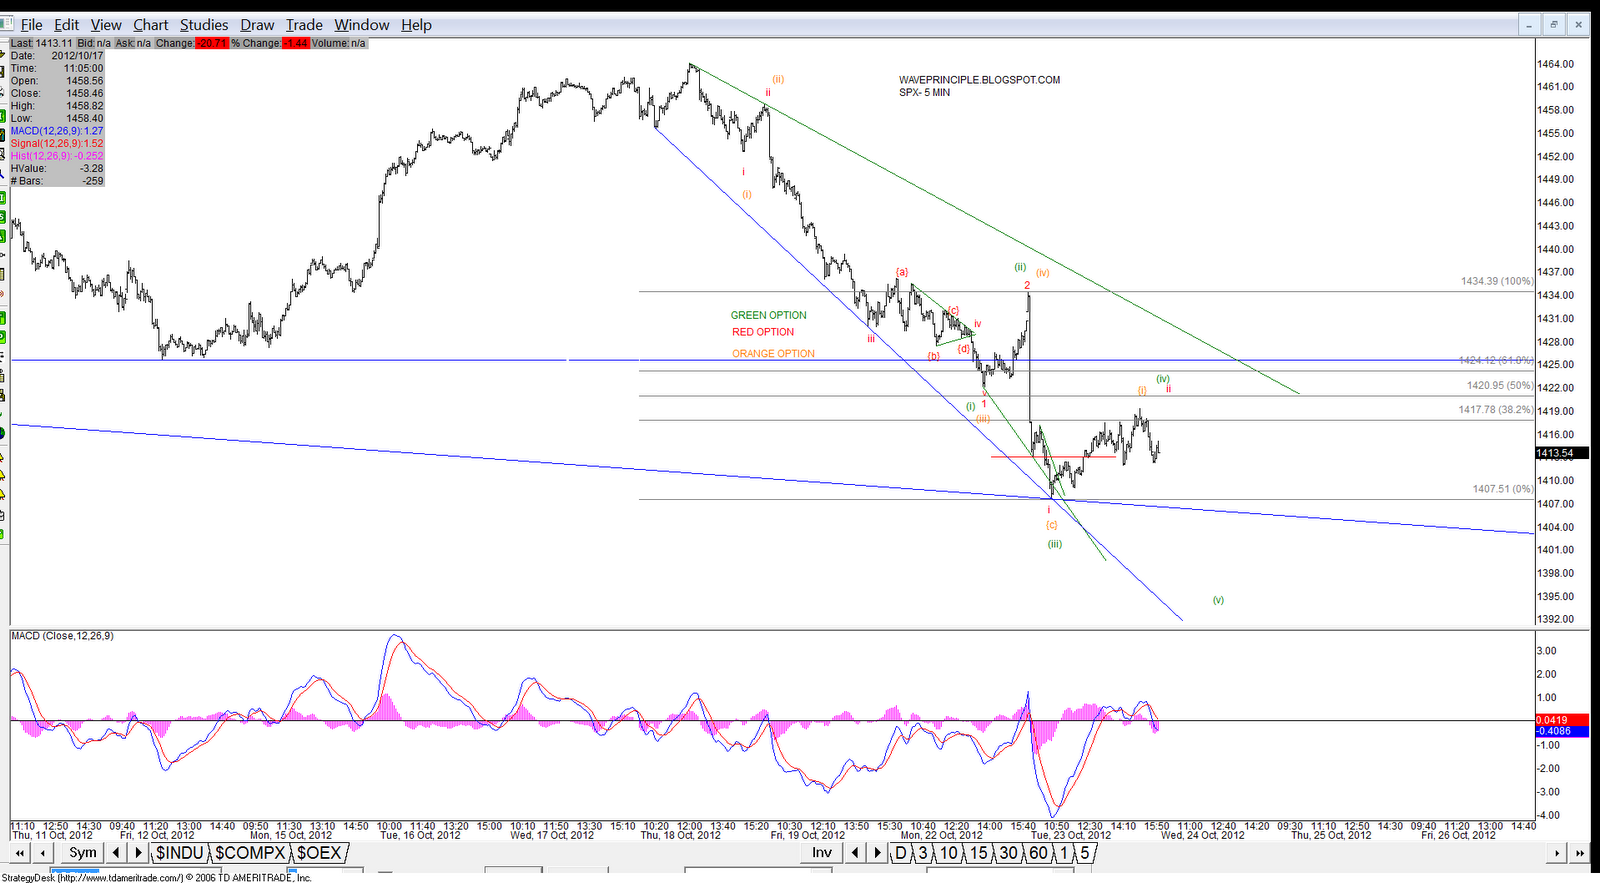
Yesterday I suggested that a flat was in the works, which would result in a lower low. Today, the flat played out.
Green looks like it may have completed five waves off the 10/18 high. Red is looking for something more bearish.
Based on the 60 min chart below, the five waves off the 10/18 either caps off {iii} down of a five wave impulse down from 10/5 or the double (wxy) zigzag orange option is complete.
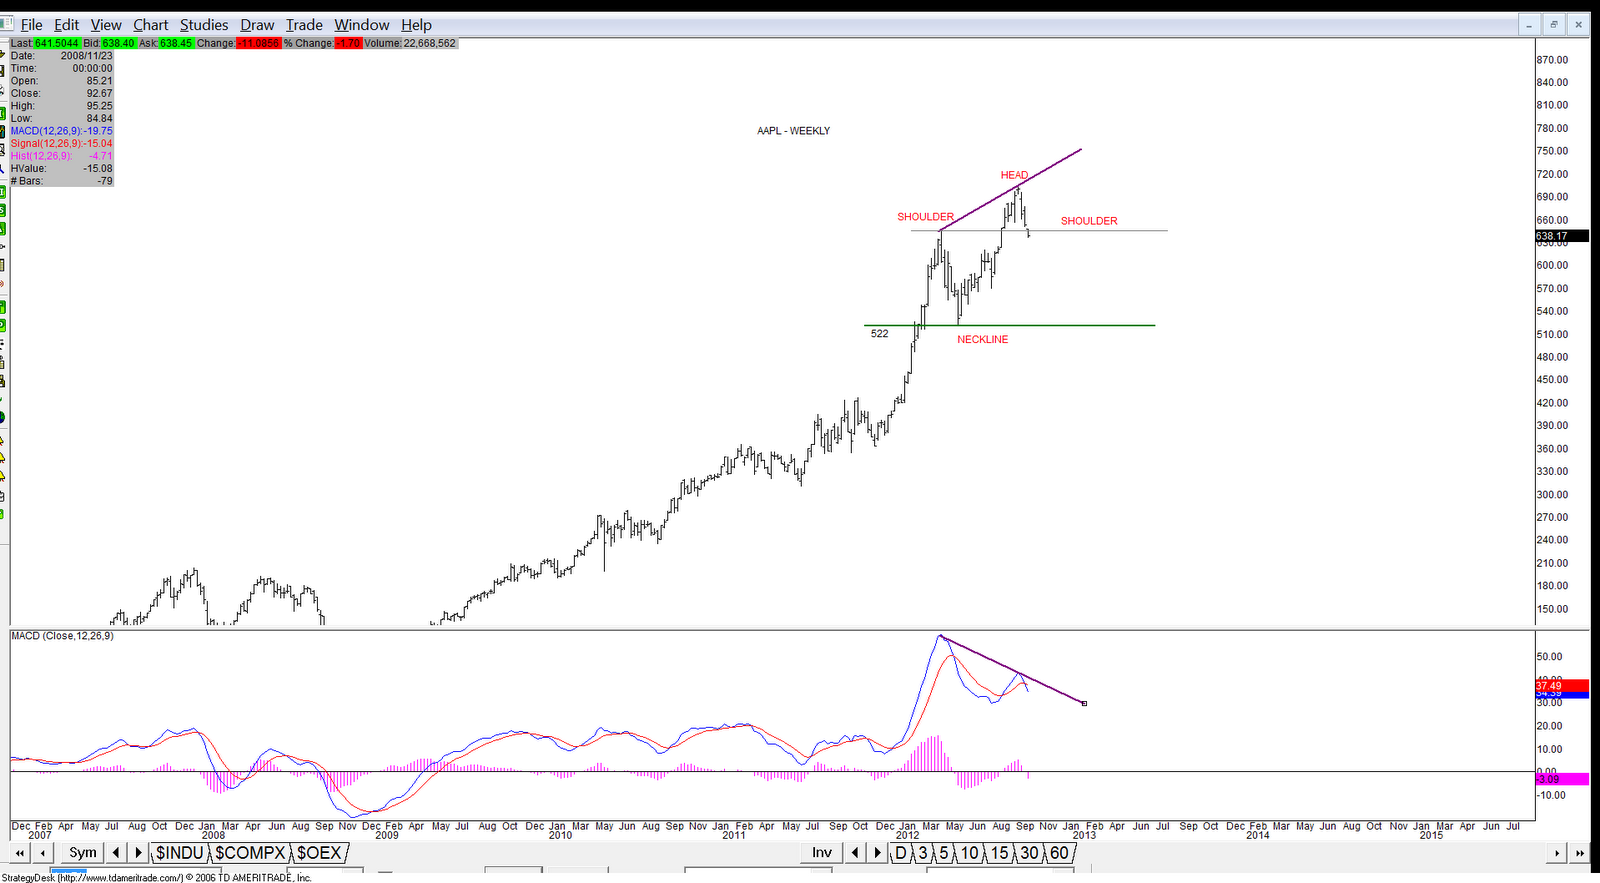
AAPL has extended beyond its H/S target and now has wave 3/C meeting the 1.618* extension target.
 |
| 5 Min |
Based on the 60 min chart below, the five waves off the 10/18 either caps off {iii} down of a five wave impulse down from 10/5 or the double (wxy) zigzag orange option is complete.
 |
| 60 Min |
 |
| AAPL - 60 Min |
Wednesday, October 24, 2012
10/24/12 - EOD Update
 |
| 5 Min |
The decline following today's high does not look impulsive either so a flat may be in the works here to either wrap up ii red or (iv) green.
 |
| 60 Min |
Tuesday, October 23, 2012
10/23/12 - EOD Update
 |
| 5 Min |
 |
| 60 Min |
 |
| AAPL - 60 Min |
 |
| AAPL - Day |
10/23/12 - AM Update
 |
| SPX - Weekly |
This is a count we must all consider. MACD looks horrible, could be setting up a triple -ve divergence should there be one final fifth to complete the ending diagonal for wave C.

The longer term view. Blue vs gray.
Monday, October 22, 2012
10/22/12 - EOD Update [4:27 PM UPDATE]
[4:27 PM UPDATE]
ES sports a nice looking double zigzag. We'll see.
A potential +ve divergence near term.
EOD Update
The bounce off the low does not look exactly impulsive for the first part of the wave structure. I will have to lean towards the red option and assume the bulls will have to prove themselves above the higher Fib retrace targets.
Will the bulls come back here or is the market setting up a 3 of 3 sell off even after backtesting the lower channel?
Doji and bounce off the lower BB.
AAPL bulls managed to create an overlap so the bears best count now is a nested 1-2 down. Note the alt option in green, which is a larger double zigzag.
The weekly may support the 3 of 3 event if the backtest of the lower TL of the wedge fails.
 |
| ES |
ES sports a nice looking double zigzag. We'll see.
 |
| McClellan Oscillator |
EOD Update
 |
| 5 Min |
 |
| 60 Min |
 |
| SPX - Daily |
 |
| AAPL- 60 Min |
 |
| AAPL - Weekly |
Friday, October 19, 2012
10/19/12 - EOD Update
Yesterday, I was expecting wave c sell off today. I didn't expect it to be this big though. The bears certainly came out to play and the bulls have their work cut out for them.
The bulls need to defend the 10/12 low at 1425.53 or the bear count is in full force below per the green option on the 60 min chart.
If the orange count is to remain in play, the bulls need to defend 1380.39.
I started tracking AAPL's head shoulders at the beginning of the month and speculated that it was leading the market. So far that has proven to be correct.
AAPL is approaching the h/s target, however, the longer term charts below suggest that wave 3/C of AAPL may very well extend to the 2.618 Fib extension.
20/50 cross over and TL break.
Weekly -ve divergence and bear cross confirmed.
 |
| 5 Min |
 |
| 60 Min |
 |
| AAPL - 60 Min |
AAPL is approaching the h/s target, however, the longer term charts below suggest that wave 3/C of AAPL may very well extend to the 2.618 Fib extension.
 |
| AAPL - Daily |
 |
| AAPL - Weekly |
Thursday, October 18, 2012
10/18/12 - EOD Update
 |
| 15 Min |
 |
| 60 Min |
 |
| AAPL - 60 Min |
 |
| AAPL - Daily |
 |
| FB- Daily |
Wednesday, October 17, 2012


Tuesday, October 16, 2012
10/16/12 - EOD Update
Da bulls are making a stand here. So far a good start but their work is not over yet.
They need to clear this out of the range as the market still has lower highs and lower lows.
Thru the hrly MACD TL.
AAPL retesting the neckline.
They need to clear this out of the range as the market still has lower highs and lower lows.
 |
| 15 min |
 |
| 60 Min |
Thru the hrly MACD TL.
 |
| AAPL |
 |
| FB |
Monday, October 15, 2012
10/15/12 - EOD Update
 |
| 60 Min |
The bears are still in the game and appears to be working on either all of {ii} or only wave (a) of {ii} before the flush down if they can hold the bulls below the lower blue channel.
10/15/12- AM Update [9:15 AM Update]
[9:15 AM Update]

Here is the cleaned up version. I had to relabel green to adjust to the 4-1 overlap that occurred last week.
Per the green option, the double zigzag is complete with a truncated wave 5 to complete wave C of Y.
The orange option, however, is the bull's best count at the moment.
Bulls need to jump this back into the ascending blue channel or a possible failed backtest of the lower channel is in the works.
AM Update

I didn't get a chance to update this chart over the weekend but just focusing on that red falling wedge right now. That would fit nicely as either a wave c or y ending diagonal.
Thursday, October 11, 2012
10/11/12 -EOD Update
Hmm... Things are looking a little dicey here for the bulls. Bulls need to defend 1430 tomorrow.
With AAPL continuing to work on its H/S target a 3 of 3 gap down may very well occur tomorrow for both AAPL and SPX.
If this were to occur, the purple count option would become the lead count for SPX.
Bear cross and respecting the MACD TL.
At the lower end of the TL.
With AAPL continuing to work on its H/S target a 3 of 3 gap down may very well occur tomorrow for both AAPL and SPX.
If this were to occur, the purple count option would become the lead count for SPX.
 |
| 15 Min |
 |
| 60 Min |
 |
| AAPL - 60 Min |
 |
| AAPL - Daily |
Wednesday, October 10, 2012
10/10/12 - EOD Update [8:26 PM Update]
[8:26 PM Update]
Here's a link (http://twitpic.com/b2y2xv) to my ES chart I tweeted earlier this afternoon. Or just take a look at it to the right.
EOD Update
I have cleaned up the count option and converted purple to green. The flat for wave 4 is just about complete just as it tagged the lower channel and lower Bollinger Band.
Must keep an eye on the 50 day SMA, which is currently at 1426. This could be a target as well.
Here are some wave c extension targets should this extend further.
c = 1.10*a = 1422
c = 1.38*a = 1410
c = 1.618*a = 1400
 |
| 60 Min |
 |
| Daily Bolllinger Bands |
Tuesday, October 9, 2012
10/9/12 - EOD Update
The market continues to move as suspected from last Tuesday's post.
Purple continues to be the primary and is looking to complete wave (v) with fib extension targets plotted on the chart to complete wave {a} of y.
Green is getting very close to invalidation.
Yesterday I also mentioned that a triangle must be considered should we see a downdraft today with a lower high. So far that has occurred so something to keep in mind.
Typically waves c or d in triangles are complex, so if this is a triangle in play versus just a simple flat (which I prefer at the moment) we should expect the next few days to be choppy and range bound.
AAPL's H/S continues to play out. Technically one may count three waves down as complete. 1/A, 2/B and 3/C, where 3/C was nearly equal to 1/A.
However, we must give consideration to the move from 10/4 as wave i of 3/C and now a wave ii bounce is occuring to backtest the broken H/S neckline.
 |
| 15 min |
Green is getting very close to invalidation.
 |
| 60 Min |
Typically waves c or d in triangles are complex, so if this is a triangle in play versus just a simple flat (which I prefer at the moment) we should expect the next few days to be choppy and range bound.
 |
| AAPL |
However, we must give consideration to the move from 10/4 as wave i of 3/C and now a wave ii bounce is occuring to backtest the broken H/S neckline.
Monday, October 8, 2012
10/8/12 - EOD Update
 |
| 15 Min |
Given that, anything can still go in this range between 1475 and 1430.
 |
| 60 Min |
 |
| AAPL - 60 Min |
 |
| AAPL - Weekly |
Subscribe to:
Posts (Atom)