Thursday, October 31, 2013

10/31/13 - EOD Update

I have a variation of an impulse count down on the 5 min below. Per the bear count, a wave 3 shall commence tomorrow.

As for the bull count, this pullback may just be wave 2 of 5 blue per the daily.


5 Min

Daily


10/31/13 - AM Update

Another possible H/S. The first tiny one was met.

5 Min - 7:05 AM


One possible way to count an impulse down.

5 Min - 6:57 AM

Wednesday, October 30, 2013

10/30/13 - AM Update

Lets see who wins this. Falling wedge or H/S?

5 Min - 10:56 AM


The bears 2nd attempt at breaking down the channel. It appears that there may be five waves down in the works but that has not really worked out so well for the bears. Lets see what happens on the back test on the underside of the channel.


5 Min - 9:45 AM

Tuesday, October 29, 2013

10/29/13 - EOD Update

No real change since last Friday. I'm still tracking the 13 wave extension on the daily chart below. The market is slowly melting up trying to complete wave v (black) of 5 (blue) of wave 13 (red).

The 15 min shows some Fib extension targets for wave v as it relates to wave i. Some thing to note is the 15 and 60 min -ve divergence so we'll see.

15 Min 

Daily

Friday, October 25, 2013

10/25/13 - AM Update

Perhaps this is working on the final fifth wave for 5 of this extension? Or wave 1 of 5 for this 13th wave extension?
Daily - 10:48 AM

Wednesday, October 23, 2013

10/23/13 - EOD Update

The intraday triangle I was tracking failed. I tweeted that the best bear case would be a double zigzag. The next best alternate is a nested 1-2 down (red label).

The 60 min below presents a case for a wave 4 in the works here so the bears should be cautious if a flush doesn't come.

15 Min 

60 Min 

10/23/13 - AM Update

Those five potential tiny waves down are actually visible on the 15 min as well.

15 Min - 10:43 AM


Wave iv of 5 underway?

Daily - 7:24 AM

Tuesday, October 22, 2013

10/22/13 - EOD Update

The ED I had been watching has now been invalidated since wave 5 is > wave 3.

The bullish count I have been following is a 13 wave extension (red labels on daily) that began over two years ago. We'll see where the market takes this into year end.


Daily

Friday, October 18, 2013

10/18/13 - AM Update

If the ED (the way I have it labeled on the daily) is to play out, than wave (v) cannot exceed 1750 or it will be greater than wave (iii).


Daily - 11:06 AM


The bears need to sell this if they want to reverse the ED. Otherwise, the bulls were able to break out, which most likely means higher highs to come.

15 Min - 7:07 AM

Thursday, October 17, 2013

10/17/13 - EOD Update

Wedges everywhere. The bulls took it to the 1730ish level I have been watching along with the upper TL of the wedge.

The question now is will there be a pause here and a small pullback/consolidation or will the bears/profit takers step in and push the market back towards the lower TL? Do the bulls have any gas left to gap and go above the upper TL of the wedge?

Pattern-wise, it would be good for the bulls to consolidate here otherwise the rising wedge with quadruple -ve divergence may be looking to erase the gains over the past 4 months or so.
15 Min 

60 Min 

Daily

10/17/13 - AM Update

1730ish target met with wedging. We'll see if this ends with another ED.
15 Min - 10:52 AM

Wednesday, October 16, 2013

10/16/13 - EOD Update

As I mentioned yesterday we should be prepared for the whipsaws. The bulls got some today and launched a 3 of 3 wave into the close to challenge the upper wedge TL near 1730ish.

The bulls cannot claim complete victory yet since this rising wedge with quadruple -ve divergence is something to be concerned about, especially since this would fit in with a "sell the news event".

15 Min

Daily

10/16/13 - AM Update

Anyone betting on a very bullish nested 1-2 up?


10 Min  - 10:17 AM

Anyone planning to sell the news at 1730ish if it gets there? Something to consider.

Daily - 7:24 AM


Anyone surprised by this? Shouldn't be. The whipsaw continues.
15 Am - 6:58 AM

Tuesday, October 15, 2013

10/15/13 - EOD Update

The next 30 some hours will be interesting. The market appears to be pricing in some type of deal being made.

Pattern-wise, looks like a falling wedge in the works and a potential for a head and shoulders. that would target approximately 1670.

Earlier, I posted the potential for a triangle as well. See the daily and 60 min charts at 12:23 PM.

Until something is firmed up by way of the debt limit we should be prepared for the continued whipsaws.
15 Min 

10/15/13 - AM Update

I'm also keeping an eye on this potential triangulation as the market waits for Congress.

60 Min - 12:23 PM

Daily - 12:23 PM


The wedge broke down. Watching the target zone and near term support.

5 Min - 11:56 AM


Bounced right at the lower TL for the larger wedge. Let's see if there is one more attempt to touch the upper TL.

5 Min - 7:29 AM

Monday, October 14, 2013

10/14/13 - EOD Update

The market is obviously watching and anticipating news from Capitol Hill. Will there be a pullback before a march higher or will there be a sell the news event?

5 Min 

15 Min 

10/14/13 - AM Update

Possible wedging up here. Let's see.

5 Min - 12:38 PM


I tweeted earlier that a potential wave 4 flat was in the works. So far that appears to be the case.

5 Min - 9:37 AM


Let's see if 1678 is an area the market is headed for.


60 Min - 7:54 AM


Looking for a wave c of (2) down for the green option. I haven't adjusted the labels for the purple option yet but the best case scenario there for the bears is a much larger dbl zigzag off the 9/18 high.
15 Min - 7:51 AM

Friday, October 11, 2013

10/11/13 - EOD Update

The bulls were strong again today. Because of this strong bounce I have made some adjustments to the 15 min chart below.
3 Min 

15 Min 
The red option has been removed because the move since the 9/18 high looks more corrective than impulsive.

The green option has been brought back and is the preferred one at the moment. It meshes well with the daily chart I have been posting below.

Not sure what to make of the purple option yet other than a possible larger double zigzag down off the 9/18 highs. The strong bounce would represent the beginning of a larger wave x.  But I'm not too sure.

I'll stick with the green option and daily chart below for now.
Daily

10/11/13 - AM Update

If the channel holds, I believe I missed one squiggle in black. there's a slight possibility it is done but that depends if the channel holds or not.

3 Min - 10:57 AM


A 3 min squiggle count. -ve divergences building so we'll see.

3 Min - 10:19 AM


Wave 5 = 1 just under 1700. We'll see what the market wants to do.

3 Min - 8:16 AM

Thursday, October 10, 2013

10/10/13 - EOD Update

By the EOD yesterday, the wave count was anticipating a move higher, which the market provided and then some.

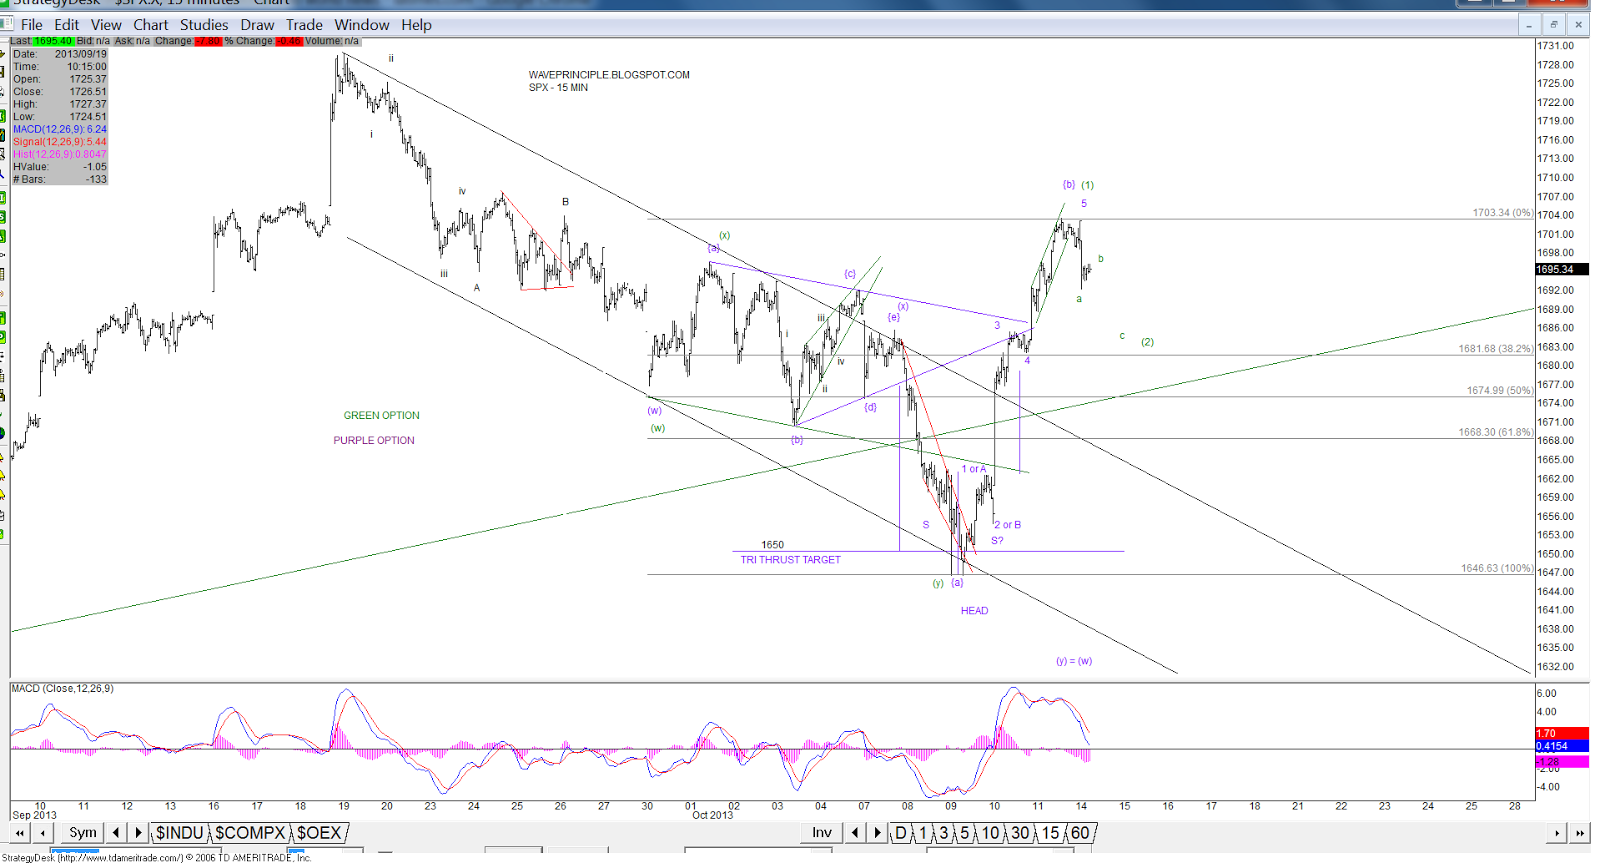
The green option has been brought back because there is no denying that the bounce off yesterday's low is an impulsive wave. The market also broke out decisively out of the descending channel and is up against the 20 day SMA again.

With five waves up, I will be looking to position (long) again after another higher degree wave 2 or B pullback is complete. A short trade could also be taken to ride a wave 2 or b down (possibly to 1670?).

A larger inverted head and shoulders could be in the works.  A symmetrical right shoulder would have the pullback near 1670 but I wouldn't be surprised if any pullback from here is shallow.

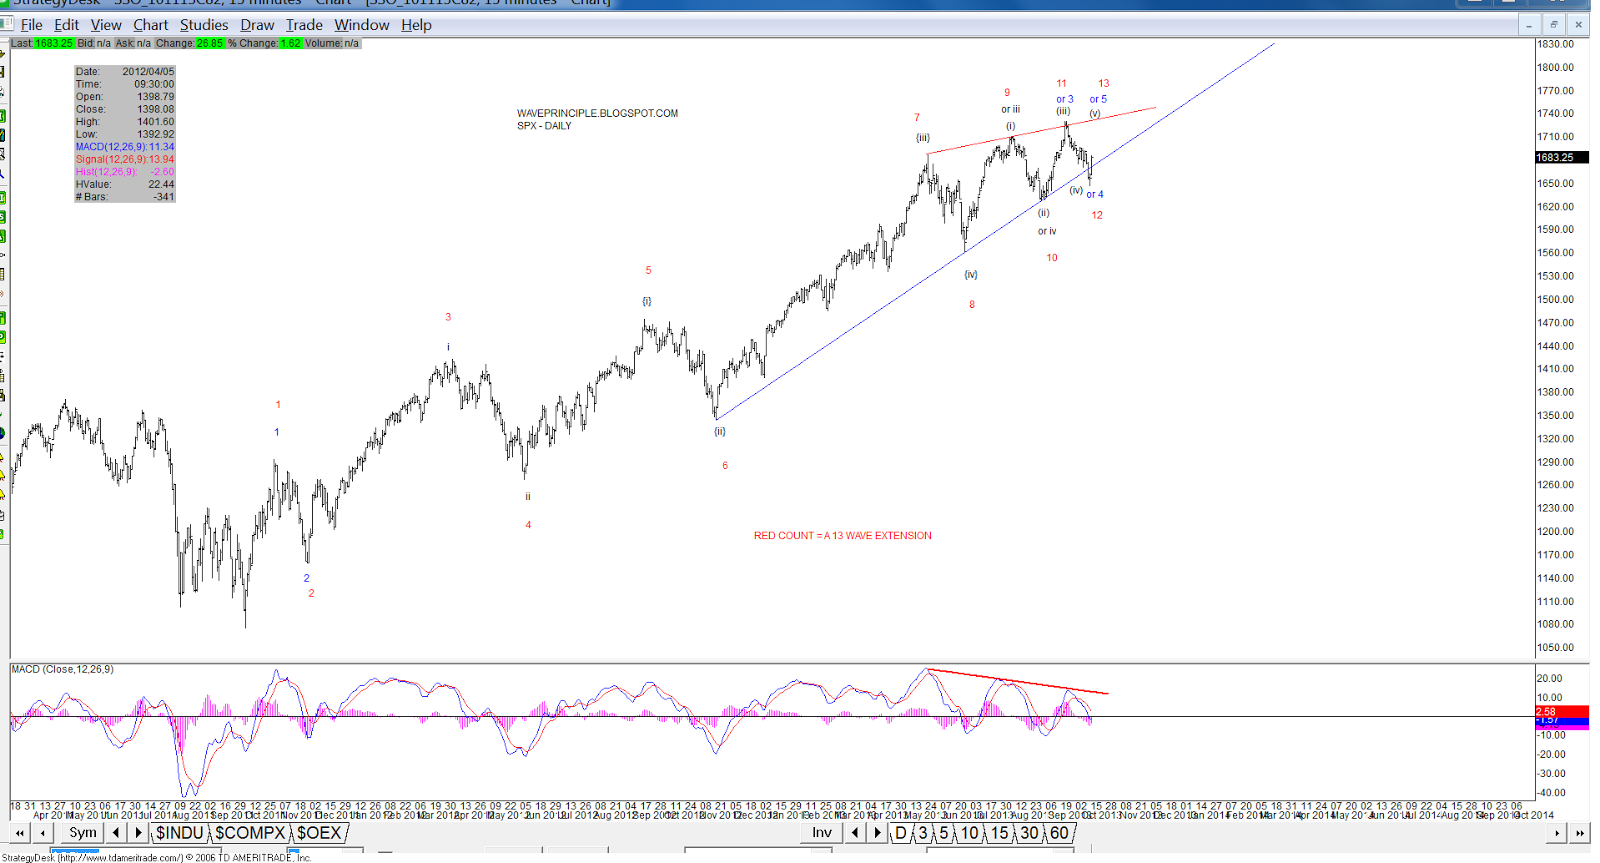
The purple option is not quite out yet but is starting to become suspect. The red option is seriously suspect so I'd keep an eye on the daily extended chart below.

The bears need to take out yesterday's low in order to continue their momentum.
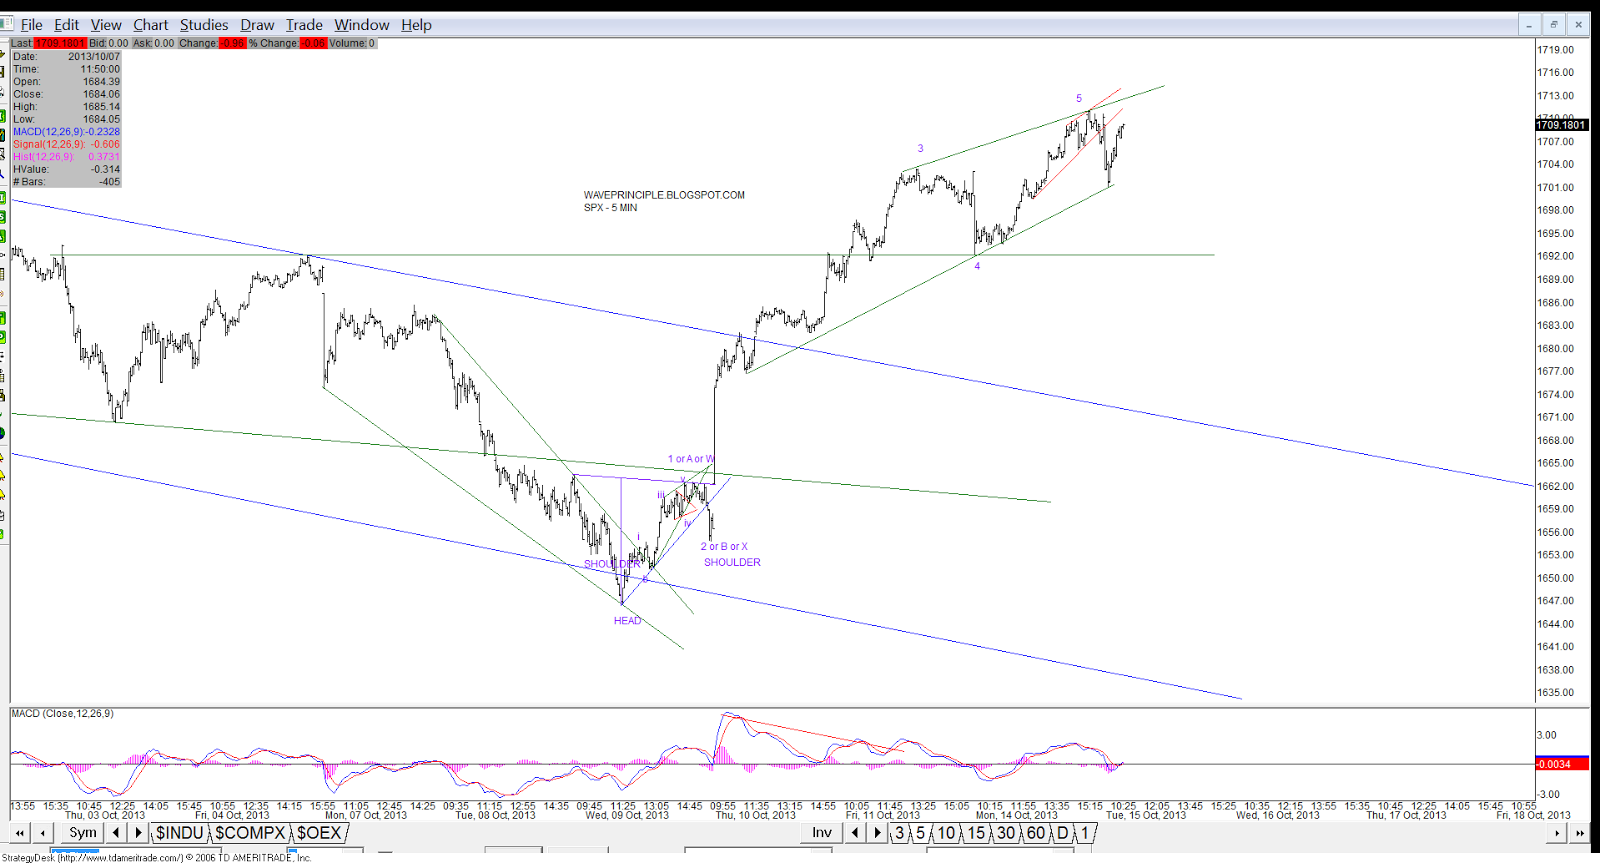
3 Min 

15 Min 

Daily - BB
Daily - Extended Option

10/10/13 - AM Update

Three waves down so far. If you are a bear wanting to short this, I'd wait for five waves down first and then short the bounce, keeping in mind the move can still be just a wave 4 in progress.

3 Min - 11:20 AM


The 3 min view. Is it possible a larger degree five wave move has completed? Target for wave 4?

3 Min - 10:19 AM


Don't forget about this chart I have posted a few times now. The TL break may just have been a throw under. So keep an eye on this for the bull option, tho it may be short lived.

Daily - 10:05 AM


Don't ya love it when a plan comes together? So far wave 3 or C has extended beyond 1.618x.

The market currently sits below the lower triangle trendline.

Something to consider is the fact that the market has broken thru the descending channel. I'll take another look for a green option for the bulls due to this move.
15 Min - 10:02 AM