Wednesday, February 9, 2011

The Golden Section Revisited


Remember this technique? Not sure one has followed through yet since I have posted on these but this one seems pretty interesting.

Here's a quick refresher on the this technique where wave 5's length is sometimes related by the Fibonacci ratio to the length of waves 1 through 3.

Per EWP, Page 137, it is written, "Unless wave 1 is extended, wave 4 often divides the price
range of an impulse wave into the Golden Section. In such cases, the latter portion is
.382 of the total distance when wave 5 is not extended, as shown in figure 4-6, and
.618 when it is."

Above, we have a fifth wave extension and within that extension just a normal fifth. Using what we know about the Golden Section and ratio, I have divided the larger 5th wave into the Golden section where the later part is .618 of the total length.

Should the wave form take on the proportions based on the terminus of wave 4 blue, wave 5 would be expected to complete near 1326.

Today, we may have seen the completion of wave 4 red of wave 5 blue. Again, using the terminus of 4, assuming the fifth wave of the fifth does not extend, the later portion is .382 the total length of the structure. Isn't it interesting that it lines up almost completely with 1326? Fibonacci may be telling us 2 things.

1. Maybe wave 4 red is complete
2. Maybe wave 5 blue does terminate at 1326

However, what if there is a fifth wave extension of a fifth wave extension? Look at the target for 5 below.

2/9/11 EOD Update [5:29 PM Update 1 Min View]

[5:29 PM Update 1 Min View]

SPX - 1 Min

Here's the 1 min view of the primary with the alternate leading diagonal count. Keep in mind there are 3 options on that chart.

1. Wave 4 completed a w-x-y and wave 5 began.
2. A Leading diagonal for wave a of 4
3. A leading diagonal for wave 1 of a larger degree 4

[4:22 PM Update -INDU]

INDU

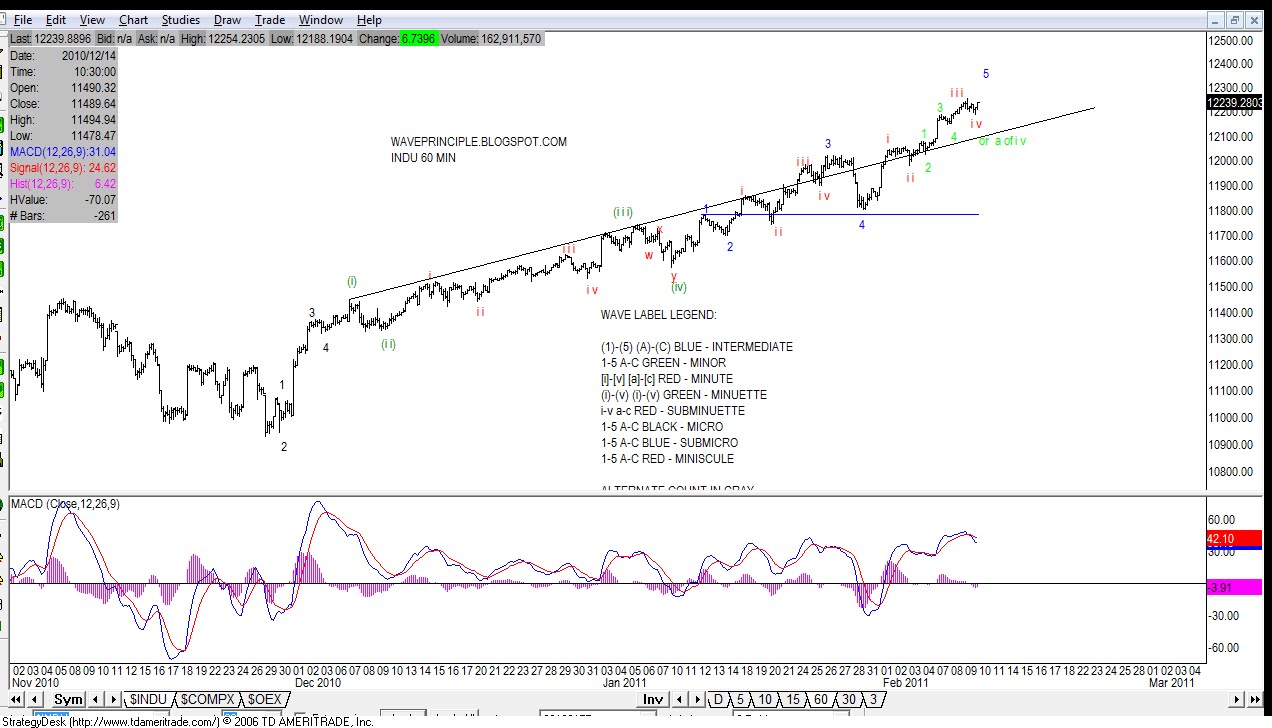
INDU is pointing towards a new high. It has a much clearer zigzag down at the top vs the possible LD for SPX. 15 min MACD crossed up through it's signal and zero line as well.

[4:11 PM Update - CSCO]

CSCO

Hold your horses everyone. Let's not start sounding the alarm bells again for the nth time. Yes CSCO is taking a hit after hours and what not but let's take a look at the charts to get a pulse of the action.

I presented this chart last week. So far, the sell off after hours has this configuration in a wave 2 pullback. We'll see in a few days if the count is legit.


EOD Update

Primary Count

With the early clues from ES this morning, I began keying in on the alternate options presented yesterday. One being that wave 3 blue completed or a possible wave 4 flat targeting the 1315-1320 level.

Sure enough it looks like we got a bounce at those levels. Whether 3 blue completed, or a flat, or parts of 4 blue is in progress, remains to be seen. For now I will label 4 blue complete with the option that today's dip was part of a double zigzag or combo for 4.

That is all I have for now. This leg surely seems like it is on it's last legs so we'll see if a new high, possibly at 1330, is made.


Here's a 15 min chart of the primary. 1308.86 is the level to watch, which would be a clue this leg up is most likely complete.

WAVE 5 Extension

Here's an update to the wave 5 extension chart presented yesterday. If this is correct, minute [iii] may be complete and we may have witnessed the begging of wave 4 down.

See chart below for the bigger picture for minute [iii]. A new high of course would rule out the above chart and confirm that the primary count is still in play.

Pre Market

Updated 5:34 AM

10 Min

Here is a close up of what the flat may look like or if wave 4 blue is in progress. Should 1320 hold, that structure is viewed as a running flat.

Pre Market


ES

ES appears to be signaling a dip at the open. One count above supports the wave 5 extension option I presented last night. However, the alternate options are wave 3 of 5 topped and a 4th is in progress or this is the last leg of a 4, which formed a flat. I'm thinking the later may be the case given the wedging pattern forming on ES.

Below is my primary count. I was expecting a tiny push higher to complete 3, which still may happen but we must consider the flat option for red 4.

If it is a flat, I believe as I mentioned last night, 1315-1320 will be levels to watch as a potential support area for it.

I have a red horizontal line which marks wave 1 of 5 at 1308.86, which coincidentally is practically the same level for wave 1 red of 3 blue. Should a dip be in progress for wave 4, this line should not be breached. If it does, I believe it may be signaling the end of this leg up that started back at the end of Nov 2010.


Much can change in the next hour and a half in ES so just things to think about.

Tuesday, February 8, 2011

2/8/11 4:01 PM Update

4:01 PM Update

Showing this chart again. Was looking at it and if repeating, tomorrow we gap and go.

3:27 PM Update


A wave 5 extension options. AS Arg reminded me of this count earlier in the day. Thank you AS Arg.


EOD Update


A simple repeating pattern that makes me believe the market is attempting to tag 1330.

Primary Count

This count continues to play out. I believe wave 3 of 5 is closing in on 1330. An alternate there is that wave 4 red may turn into a flat, which would require a little dip down to 1315-1320.

Here's a 10 min view.

Wave 3 Extension Option

I'll continue to monitor this chart as well.

Update on the channel chart.

ED Option

I can't believe I missed this but the ED Option I have been presenting is not valid. Wave 4 does no retrace back into wave 1, which is a rule.

This came up again in the chat room and I can't believe I missed this one. Once again, EWP, 10th Ed, Page 88, it is written, "Wave 4 always ends within the price territory of wave 1."

Obviously that hasn't occurred here so we'll just treat this as most likely an impulse wave up.