A reader emailed me a few days ago asking if the current period is mimicking the 1976 period. Honestly I hadn't looked at my long term chart in a while but only did so in response to the reader.
Anyway, the answer is yes, at least that is how it appears and how I had it labeled. The hope rally is still working on wave D and so far based on the other long term counts I have presented either a wave W completed so far or a wave A of D.
Notice how wave 4 alternates nicely with wave 2?
Stock Market Analysis With The Elliott Wave Principle -Dow Jones, S&P 500, Russell 2000, Nasdaq and FX. All charts and commentary on this site are strictly the opinions of the author(s) and are for recreational purposes only. In no way should this be construed as trading advice or a recommendation for investing. See disclaimer at the bottom of the page.
Wednesday, October 5, 2011
AAPL to $300?
![]() |
| 20 Year |
I believe AAPL has completed five waves up since 1997 and capped it off with an ending diagonal that has now broken down. .
A large daily -ve MACD divergence has also been confirmed. A target for a potential h/s is 300. The right shoulder will need to form first which may crawl up the underside of the ED near 400.
EOD Update [2:42 PM Update]
[2:42 PM Update]
Here's a cleaner version of the 15m chart that incorporates the triangle I proposed last night. Anyway, I've added a potential for an extended third wave 3, which would call for a break away gap tomorrow morning.
The only reason why I add the 3rd wave extension there is because wave 4 blue just does not look right compared to wave 2 blue. For some reason I believe the market may still be working on wave 3.
Anyway, we'll know early by tomorrow and 1150 is still a level it must clear. Don't forget the 20 day SMA is at 1163 so it may be gunning for it.
EOD Update
Looking for the first five waves up to complete. Perhaps it will target 1150-1155. See the pitchfork chart below.
Keep in mind 1150 is the 62% retracement level of the leg down starting from 9/27 to yesterday's low.
1155 is approximately at the top of the upper fork channel.
This goes hand in hand with the 15 min chart above. Looking for the completion of wave 1.
This count is losing credibility fast. Based on this count, there is a triple nested 1-2 down and if the ALT B yellow is used, a double nested 1-2 down. Given the +ve divergences I'm going to say the odds of this count being right is pretty slim at the moment.
I continue to track copper for signs of a turn-a-round. An addtl hrly macd buy signal confirmed into the close. I'm wondering if the final 5th wave of the ED truncated.
For a view of the bigger picture, click here.
Let's see if the equity buy signal works this second time around.
Here's a cleaner version of the 15m chart that incorporates the triangle I proposed last night. Anyway, I've added a potential for an extended third wave 3, which would call for a break away gap tomorrow morning.
The only reason why I add the 3rd wave extension there is because wave 4 blue just does not look right compared to wave 2 blue. For some reason I believe the market may still be working on wave 3.
Anyway, we'll know early by tomorrow and 1150 is still a level it must clear. Don't forget the 20 day SMA is at 1163 so it may be gunning for it.
![]() |
| 15 Min |
EOD Update
![]() |
| 15 Min |
Keep in mind 1150 is the 62% retracement level of the leg down starting from 9/27 to yesterday's low.
1155 is approximately at the top of the upper fork channel.
![]() |
| Blue |
This goes hand in hand with the 15 min chart above. Looking for the completion of wave 1.
![]() |
| Red |
![]() |
| HG - 60 Min |
For a view of the bigger picture, click here.
| VIX - Daily |
Tuesday, October 4, 2011
EOD Update [9:32 PM Update]
[9:32 PM Update]
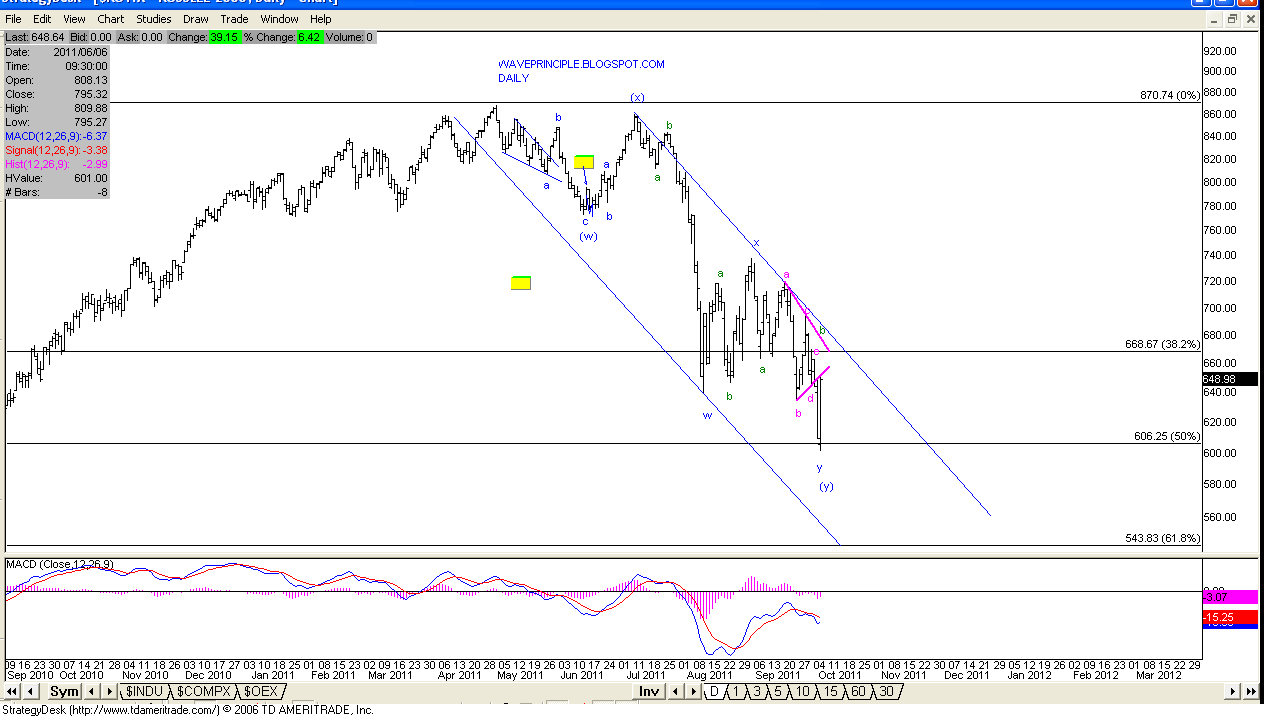
scw and I were briefly discussing the RUT earlier in the chat room. After looking at the count some more, I believe there was a triangle within the consolidation we saw the past two months after all.
Below is the daily picture for the RUT. Take a look a the two 60 min charts that follow. The first examines the count at the top and why I believe it should count as corrective vs impulsive (this same argument is made for SPX).
The second 60 min chart highlights the triangle that plays out to complete the entire corrective sequence from the July high.
If this is correct, this changes things quite a bit in terms of what type of bounce/rally to expect. I acknowledge that on the daily view, the structure overall looks like a five wave structure. However, one thing I am learning with EW is that W-X-Y correctives also appear as five waves from a higher level view.
It's when we drill down deeper within the squiggles, as in this case, that it is more recognizable as a corrective structure.
Now couple these counts with the one I presented for DJT below and my copper count and now it can be argued that a three wave corrective structure may have just completed today.
We all know nothing is certain. One thing that we do know though at the moment is that both counts (my corrective or the five wave decline count) calls for a bounce. Couple this with several +ve divergences that were confirmed today and the odds are pretty good in our favor that we should see a decent size rally.
The only difference is that one will be prepared should the rally choose not to stop near the 50%, 62% or 78% retracement levels. Better yet, we won't be scratching our heads and blaming "them" for manipulating this market to new highs wondering why it got there.
Copper is presenting the same count. A clean three wave corrective down to 50% retracement following a pretty clean five wave move up.
EOD Update [4:38 PM Update]
The transports surely make for a very clean three wave corrective move down by way of count and form. The only draw-back to this count is the fact that wave 3 of the ED for wave C is longer, which invalidates it as an ED.
I would hesitate to call it a five wave move down from it's July high because wave 4 would be so bloated and so unproportional.
NDX looks good too as a corrective move off it's high. The question is does it count best as an ABC or WXY? It matters because an ABC implies one more test of the lows vs a WXY has the count complete.
See below for this.
In fact looking at the structure off the low, it appears that a leading diagonal may have formed and a steep three wave retrace. However, I can see an issue with wave 3 of this proposed LD though.
EOD Update
What a wild day today. That is to be expected with an elevated VIX.
Buyers and shorts covering managed to move the market nearly 50 points off the day's low.
I have modified my blue count to match the big blue and big blue2 charts below. I posted this one a few times in the chat room and feel this is the best explanation from a corrective stand point.
The correction is still hovering near the 38% retracement of the entire hope rally and bounced off the blue TL today. Keep in mind the PRIMARY 1/A and PRIMARY 2/B labels can easily be substituted for W and X respectively.
Should the market find a reason to rally to new highs from here it may either be a wave 3/C/Y.
Look at the large 60 min MACD +ve divergence.
A positive divergence also formed on the daily McClellan Oscillator.
Should the whipsaw continue, the red count calls for a wave iv retrace possibly to 1133 before heading back down to complete wave iii red.
Notice the ALT label. Should wave B yellow have completed there, then a nested 1-2 i-ii down should be considered. Today's rally into the close would be wave ii and that would allow for more room to the upside as part of it's correction. 62% takes it to approx 1150.
Here's an internal count wave iii gray. It is still possible that wave 4 of iii gray may be a zigzag that completed at the end of the day. Tomorrow should provide clues as to whether that is correct.
In the last go around, the equity buy signal did not materialize. Will have to keep an eye on this one. Will be looking for step 3 to confirm the signal tomorrow.
scw and I were briefly discussing the RUT earlier in the chat room. After looking at the count some more, I believe there was a triangle within the consolidation we saw the past two months after all.
Below is the daily picture for the RUT. Take a look a the two 60 min charts that follow. The first examines the count at the top and why I believe it should count as corrective vs impulsive (this same argument is made for SPX).
The second 60 min chart highlights the triangle that plays out to complete the entire corrective sequence from the July high.
If this is correct, this changes things quite a bit in terms of what type of bounce/rally to expect. I acknowledge that on the daily view, the structure overall looks like a five wave structure. However, one thing I am learning with EW is that W-X-Y correctives also appear as five waves from a higher level view.
It's when we drill down deeper within the squiggles, as in this case, that it is more recognizable as a corrective structure.
Now couple these counts with the one I presented for DJT below and my copper count and now it can be argued that a three wave corrective structure may have just completed today.
We all know nothing is certain. One thing that we do know though at the moment is that both counts (my corrective or the five wave decline count) calls for a bounce. Couple this with several +ve divergences that were confirmed today and the odds are pretty good in our favor that we should see a decent size rally.
The only difference is that one will be prepared should the rally choose not to stop near the 50%, 62% or 78% retracement levels. Better yet, we won't be scratching our heads and blaming "them" for manipulating this market to new highs wondering why it got there.
![]() |
| RUT Daily |
![]() |
| RUT - 60 Min Close Up At The Top |
![]() |
| RUT - 60 Min Close Up At The Bottom |
![]() |
| SPX - Daily |
![]() |
| Blue |
![]() |
| HG |
EOD Update [4:38 PM Update]
![]() |
| DJT |
I would hesitate to call it a five wave move down from it's July high because wave 4 would be so bloated and so unproportional.
![]() |
| NDX |
See below for this.
![]() |
| NDX- Close up |
EOD Update
What a wild day today. That is to be expected with an elevated VIX.
Buyers and shorts covering managed to move the market nearly 50 points off the day's low.
I have modified my blue count to match the big blue and big blue2 charts below. I posted this one a few times in the chat room and feel this is the best explanation from a corrective stand point.
![]() |
| Big Blue |
![]() |
| Big Blue2 |
Should the market find a reason to rally to new highs from here it may either be a wave 3/C/Y.
![]() |
| Blue Count |
![]() |
| Daily McClellan Oscillator |
![]() |
| Red Count |
Notice the ALT label. Should wave B yellow have completed there, then a nested 1-2 i-ii down should be considered. Today's rally into the close would be wave ii and that would allow for more room to the upside as part of it's correction. 62% takes it to approx 1150.
![]() |
| 5 Min Bear |
![]() |
| VIX |
Subscribe to:
Posts (Atom)