[Sunday 10/9 - 5:10 PM Update]
With ES up 9 points as of this posting and
assuming that it holds, this chart I posted in the chart room Friday is going to be the one to watch.
And though I added that 10 min chart below showing a completed five wave impulse up, I can't ignore what ES may be telling us. Again, we should have a better clue near the US market open tomorrow morning.
A positive 5-6 point open tomorrow still leaves room for it to be a wave 2 of c down.
 |
| 5 Min |
[Sunday 10/9 Update]
 |
| 2008 REPEAT? |
Just adding to the comparisons being made with 2008. Once again, I still don't buy the move down from 5/2011 as a five wave impulse.
However my alternate count does allow for a three wave move down off the 5/2011 high as a W-X-Y so this analogy to 2008 would still work up until the end of the third leg.
 |
| DJI |
 |
| Channel |
I'm adding this 10 min chart update to Friday's EOD Update here just to keep things all together.
The more I looked at the squiggles, the more I liked this as a completed five wave impulse up (wave 1 black) with a flat for wave 2 in progress.
Of course we shouldn't ignore the fact that the pullback could still be a wave 4 so I have left the alternate green labels in.
Irregardless of whether it is a wave 2 or 4 pullback, I do like the solid Fib confluence at 1134.xx. So should the market open red Monday, this will be the first level I'll be expecting a bounce if 1150 is taken out.
 |
| 10 min |
EOD Update
Looks like the bulls may have the advantage at the moment over the next several week due to several positive divergences that were confirmed this week.
 |
| Big Picture |
Here's a weekly refresher on the longer term count. The primary view is that a primary degree wave 2/B/X has completed and a very bullish Primary degree wave 3/C/Y has begun. The alternate view is that a minor degree wave W completed and now a minor X is underway.
So it doesn't' really matter if one disagrees with the primary view at the moment. Both views are looking for a decent size bounce towards 1220-1250. This is a 50% retracement from the 5/2011 -10/2011 decline.
Notice that if you believed there were five waves down from 5/2011-10/2011, a bounce of this magnitude is also expected.
 |
| Blue Count- Primary |
Here is a daily view of the Primary long term count. We are looking to identify the completion of wave i of 1. Based on the 15 min chart below, it's pretty close if not already completed.
 |
| 15 Min |
I'm still a little unsure if five waves up have completed. For now I'm leaning towards a wave 4 flat is in progress with wave c down of the flat into the close.
If 1150 does not hold early next week, 1136 appears to be a good target for wave 4. 1136 is the 38% retracement of wave 3 and wave c=1.618*a of 4, which is a nice confluence.
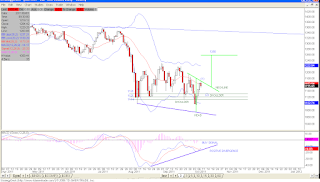
If the market has completed wave 1, I'm then expecting a wave 2 retracement near 1123. If wave 2 down arrives at this level, this would set up a right shoulder of an inverse head and shoulders bottom with a 1250 target. See the Bollinger band chart below.
Keep in mind 1136 also fits into the picture as a retracement level here.
 |
| Daily Bollinger Bands |
 |
| Channel |
The market managed to close back above the mid channel. Let's see if the market targets the red TL above.
 |
| HG |
Still tracking Dr. Copper and it also appears to be working out a wave 4.
 |
| EWG - ISHARES MSCI GERMANY |
Let's keep an eye on Germany as well for clues. So far it appears to be on par with SPX and Copper.
 |
| Red Count |
I don't have too much faith in this count anymore especially wave ii yellow. It certainly cannot be deemed complete yet because at the moment it looks impulsive and would thus mean it has only complete wave a with waves b and c to come. By the time wave c comes, it may retrace back beyond wave i yellow.
 |
| VIX |
The VIX equity buy setup appears to have followed thru this time around. It also closed below it's 20 day SMA today after a failed backtest. The last time this occurred it proceeded to drop to 30. This tends to support the move higher for SPX.


