Stock Market Analysis With The Elliott Wave Principle -Dow Jones, S&P 500, Russell 2000, Nasdaq and FX. All charts and commentary on this site are strictly the opinions of the author(s) and are for recreational purposes only. In no way should this be construed as trading advice or a recommendation for investing. See disclaimer at the bottom of the page.
Wednesday, November 7, 2012
11/7/12 - EOD Update
I posted this chart back on 10/23 and warned this is a count to consider. Here we are today. Lets see what happens.
Tuesday, November 6, 2012
Friday, November 2, 2012
11/2/12 - EOD Update
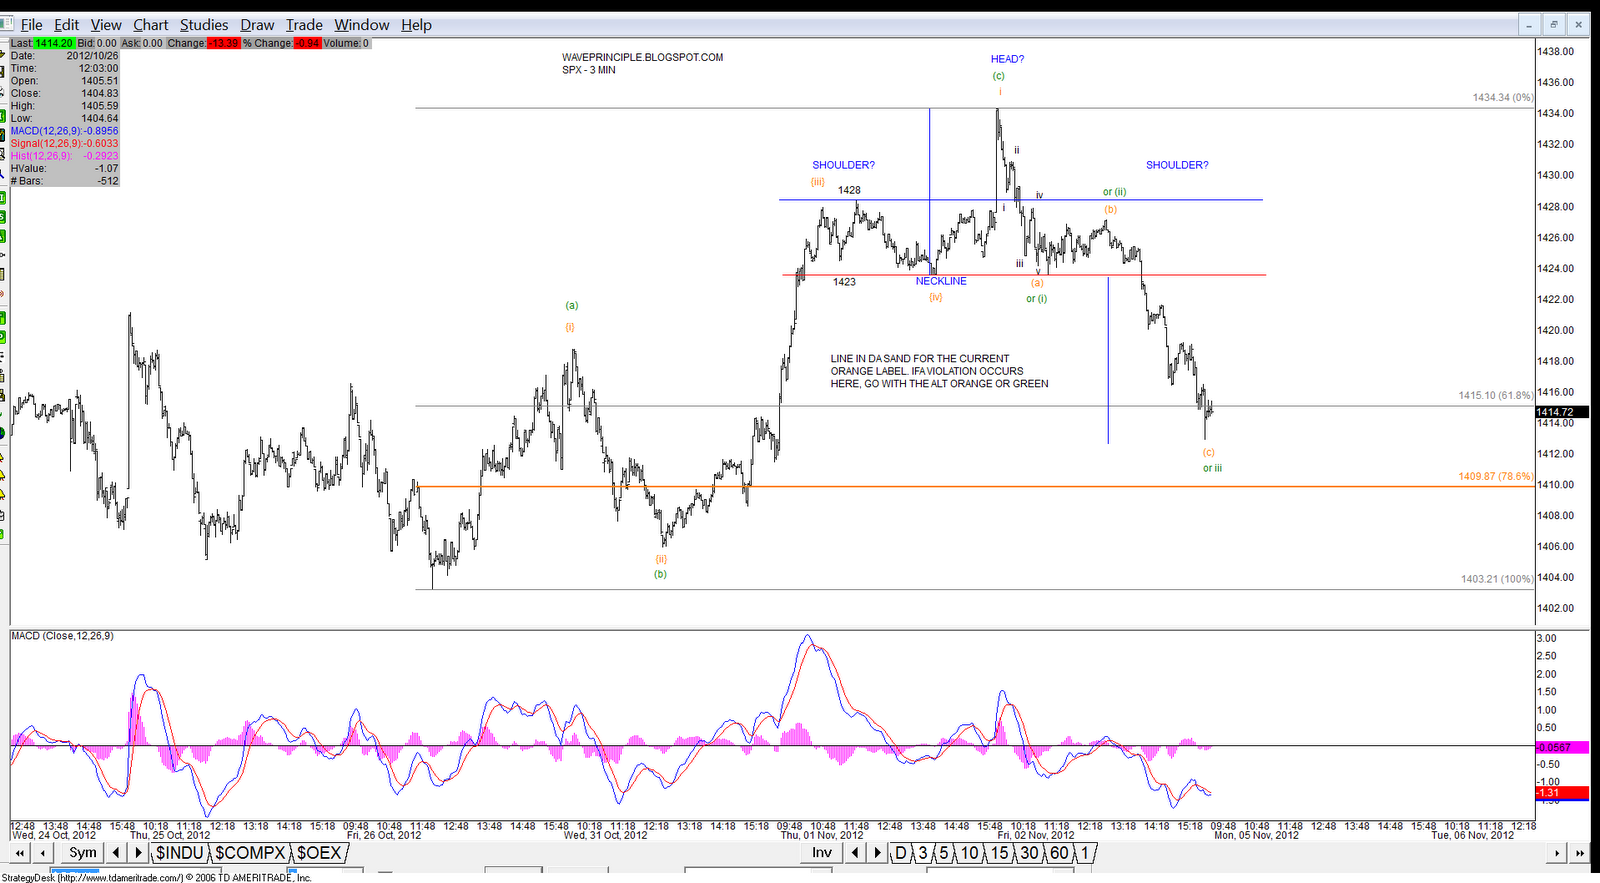
The market continues to make lower highs and lower lows but also appears to be wedging. If the bulls want a shot at the 1474 high, they need to get moving soon here.
Green and Orange moving right along. Wave (c) of ii orange is nearly 1.38 * wave (a) of ii.
AAPL is extending lower. Note the 2.618* extension target.
The weekly shows that short term support may hold at 570 before a bounce. After that bounce, we'll have to see if it truly is a right shoulder before heading lower to 520.
Have a great weekend!
![]() |
| SPX - 3 Min |
![]() |
| SPX - 60 Min |
![]() |
| AAPL - 60 Min |
![]() |
| AAPL - Weekly |
Have a great weekend!
Thursday, November 1, 2012
11/1/12 - EOD Update
Subscribe to:
Posts (Atom)