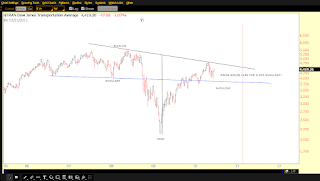
[10:00 PM Update: Transports Inverted Head and Shoulders?]
Hmmm...
The market was able to stay above the 200 DMA today even with bearish news throughout the day. The media and "pros" claim that the market is trading strictly on technicals right now so given that, the technicals I follow (13, 21, 34 EMAs, MACD and RSI) show that we trade more towards the bullish side short term (60 min).

SPX 60 MIN BULL COUNT
The count above is still my preferred. I made changes to the labels since the 1042.17 bottom.
Currently I show 5 waves up to form subminuette i of minuette (iii). It is possible that the fifth wave has a little more to go. I believe a squiggle count would indicate this.
The 60 min MACD provided a sell signal today, which would correspond with a subminuette ii pullback is in store.
I placed Fibonacci retracement targets for subminuette ii. A 62% retracement towards 1090 corresponds well with the 20 day MA, which is the middle bollinger band.
SPX 15 MIN
SPX DAILY EMAs
Price closed above the 13, 21 and 34 EMAs today. A cross up of the 13 and 21 appears to be in the works. We'll have to keep an eye on this action. It is starting to look like Feb 2010 again.
SPX 60 MIN EMAs
The 60 min chart shows that price is repecting mainly the 13 EMA with one touch of the 21 after the 13/21 cross. At today's close, 1099 represents the 34 EMA.
SPX DAILY AUG 2007 COMPARISON
SPX DAILY BOLLINGER BANDS
Following up with the 'W' bottom here. The market stayed above the 200 DMA and the MACD and RSI still have room to run higher. The upper band sits at 1123.
SPX 60 MIN BEAR COUNT 1
Once again the bear counts follow the bull count short term. Both are looking for a pullback. However, if this count is correct, it should be the beginning of minute [iii] down. This should take out the current lows. A failure to do so would require that this bear count be revisited.
SPX 60 MIN BEAR COUNT 2
This second bear count also implies the same thing, a pullback. However, this count, indicates that minuette (iii) down should be begin.


