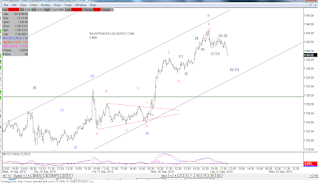
Wednesday, September 22, 2010

9/22/10 - EOD UPDATE#2

60 MIN
I'm just posting some additional thoughts on what I see. I have drawn three parallel lines (blue) that appear to have contained the market action thus far.

On the chart above, MACD is sporting a negative divergence and given that I have the count complete for minuette (i), it stands to reason this negative divergence is indicating that minuette (ii) is in progress.

Guess where the 50 SMA sits? 1129.40 to be exact. That also lines up with the middle trendline. Will the market find support here or does she break through? See below should 1130 fall.

DAILY
Here we zoom out to the daily view and a few things standout as well. I show a MACD that is trending postively, the 50 SMA at 1097 and the 50% retracement of the rally right around 1094.

At this degree, it makes sense that a minuette (ii) would pullback towards the 50 SMA and a 50% retracement. It also would fall on that bottom trendline.

If the daily MACD trendline is intact, I believe it would provide support again at the end of minuette (ii).

9/22/10 (EOD UPDATE)

(EOD UPDATE) 
EOD - 5 MIN


If my 9:45 AM call is to pan out, wave (5) must be considered truncated. See below for the updated count.


EOD - 5 MIN UPDATE


I have the diagonal labeled as 5 waves down and a breakout of the diagonal as a possible double zigzag currently working on it's final wave (Y). (Y) may not hit the 78.6% retrace and only target 62%. We'll have to see.


(9:45 AM UPDATE)

9:45 AM - 5 MIN
Ok. Let's see if we can make it 2 in-a-row. This is my call for today. 

That leading diagonal is back on the table. I say we hit 1130 in either the LD or the double ZZ ([W]-[X]-[Y]). We then bounce sharply, typically 78.6% out of a LD, which backtests that lower channel. 
We fail the backtest and work our way back down in a wave 3 or C. 

If this move down was only a wave 4, then the final 5th will finally be upon us but I'm going with the LD for either a wave A or 1 down of minuette (ii).


This is gonna be my last post for the day since I have to attend several meetings. We'll see what happens at the end of the day. Good Luck!

(9:30 AM UPDATE)

9:30 AM - 5 MIN
A slight update. I just relabeled the alternate corrective count to a [W]-[X]-[Y]. Know the difference? An [A]-[B]-[C] = 5-3-5 whereas a [W]-[X]-[Y] = [5-3-5] -[a-b-c]-[5-3-5].


I'm thinking the 1130 level is going to come into play as [Y] completes there and the mid channel. We'll see. So basically, I'm saying that the odds are increasing again that this may be corrective after all.


9:30 AM - 5 MIN
Wedgie may be back on again as well.


(9:15 AM UPDATE)

9:15 AM - 5 MIN
I'm not going to post my 1 min chart but it appears at that degree, the waves since 1148.59 are very overlapping, which leads me to believe that this may be more corrective in nature rather than impulsive. 

Given that, I have added the alternate corrective labels but will still not ignore the hourly MACD sell signal. If the corrective label is correct, 1130 (green line) may provide some support and [C]=[A] right in that area.


(8:53 AM EURO UPDATE)

8:53 AM - EUR/USD
Remember this post?That proved to be telling. 

Here's an update to that count. It is in a wave 3 or C and I'm thinking it is only on wave 3 of 3 or C. 

A typical fib extension of 1/A is equality and that would place the EUR/USD near 1.40.

Once again, notice the positive MACD divergence. What does that tell me? It tells me to keep in mind that this may not just be a 3 wave corrective move up, at least not at the degree to which I have it labeled. It's telling me that we may end up seeing 5 waves up of a larger impulse or 5 waves up for just a wave A. I'll keep you posted.

(8:26 AM UPDATE)

8:26 AM - 5 MIN
The market is showing her hand a little more. I'm taking the wedge off the table. It's most likely an impulse down in the works for minuette (ii).
 

(8:00 AM UPDATE)
8:00 AM - 30 MIN

8:00 AM - 5 MIN

So far this AM the market is moving as expected. The hourly MACD is in sell mode and the lower channel (30 min) was breached.

The 5 min chart shows two potential counts. Either we are in a leading diagonal to start off minuette (ii) or this is yet another wave 4 as speculated last night (even though with low odds).

DAILY MAs


The daily MACD histograms are starting to trend lower possibly signaling a daily sell. However, my thoughts are that the green rising trendline will provide support yet again where minuette (ii) completes. If it doesn't, something else is going on.  So let's keep an eye on this.

Tuesday, September 21, 2010

9/21/10 (EOD Update And People Say EW Does Not Work?)

(EOD Update)

EOD - 5 MIN

30 MIN

Well here it is. 1148.59. Not bad, pretty darn close to 1150.

As posted at 10:07 AM below, I was expecting a pop for 5 and then a selloff / pullback into the close. It's as if the market read my blog (ya right!).

I hope some folks who have their doubts about EW may have found this useful at this smaller degree. With that being said, I'm not saying EW is the end-all be-all tool but something else to add to your tool belt.

Now for the charts above. As far as I can tell, this impulse up looks like it is mostly complete. I have adjusted the labels and degrees to best fit what I have counted.

With that being said, I'm going to leave room for another (yes another) possible wave 4 (degree unspecified) if we are still in the final fifth up. But I'm not really banking on this.

As I also posted early, the hourly MACD was looking a little bearish, which by the close provided a sell signal.

Expanding Option

I guess this would be considered my option number 6. This one is for da bears.

I posted this on Monday during my chart blitz. No changes were made with the trendlines. Interesting that we rallied to the middle trendline and sold into the close. Hmmmm..Of course the bullish argument is that we just hit the upper channel of a new ascending channel.

Gotta run for a bit.

(11:40 AM Update)

1150 here we come. 5=1 at 1150.

(11:25 AM Update)

11:25 AM - 10 MIN POST FOMC
Boo Ya Baby! Now let's see how high this 5 goes. I have also adjusted the degree labelings to reflect what my suspicions were this AM.

(10:47 AM Update)

10:47 AM - 3 MIN
 I see a wedgie forming.

(10:07 AM Update)

DAILY PREFERRED - 10:07 AM

Ok. This is how I see it. We are sloshing around in a wave 4 to complete the final 5th for minuette (i) and the market is 1hr away from the FOMC minutes.

The way I see this playing out is that the market pops on the news or lack thereof to complete this final 5th. Then as usual, we see a selloff/pullback after the fact.

A break below 1131.47 will void this scenario. If this is right, go ahead and tell people you saw it here first. If I'm wrong, well then I'm wrong ;). We'll see in an hr or two!

8:30 am - 5 MIN
So far we have a very small scale trend change. That may turn out to be a larger one if minuette (i) is complete. As posted last night, I was expecting this pullback.

One thing I may add is that this pullback could still be yet another wave 4 of some degree. That is why I added the [A],[B] and [C] labels for the pullback as an option. [C]=[A] at 1138 and 1.618*[A] at 1136. We'll see.

I'm thinking most likely not though since the hourly MACD is heading lower and showing a bearish configuration along with a negative divergence.

All eyes and ears are on the FOMC meeting minutes today and the 1131 level.

MAs
Here are some MA levels for possible support should 1131 break. On another note, the battle of the head and shoulders resulted in the inverse ruling. We can also call it a diamond bottom reversal and possibly a 'W' bottom. The one major caveat to all this is the lack of volume on the breakout so be careful.

Monday, September 20, 2010

9/20/10 - EOD - RECAP OF MY BEAR AND BULL COUNTS

3 MIN
Here's a count on the 3 min chart. We may have seen the end of minuette (i). See here for the daily chart.

I apologize for the earlier snafu with the links for the charts. They are functioning correctly now.

DAILY PREFERRED
Here's an update of my daily preferred chart. I show us close to completing minuette (i) of minute [iii] of C. If this proves to be correct, a pullback for minuette (ii) should be up next. Given the typical Fib retrace levels of 50 - 62%, (ii) can easily retrace back to 1092-1080 and back test that red channel that it broke out of.

A (iii) of [iii] up would be follow that (ii) pullback and further confirm the bullish weekly MACD cross.
DIAMOND BOTTOM
One chart that has kept me on the bullish side of the house.

CHANNEL
Another chart that has kept me on the bullish side. The market is clearly over the quarter channel and is headed for the mid-channel. The minimum level for a kiss of the mid channel now is approximately 1180.


FIBONACCI FAN
If these fans mean anything. I have watched this one for quite sometime now and never really posted an update on it. The minimum level for the overhead fan resistance is approximately 1225.

The following charts below are various bear counts that I also watch. Some imply intermediate term bullishness before any bear returns.

OPT 3
This option has us wrapping up wave C of Y. C=A=1158, which we are very close. However, keep in mind that C may also equal 1.618*A=1231 and 2.168* at 1350.

OPT 6
This option has us working a wave (B) which may end at 1158 with a possibility of a flat forming. If that were the case, (B) would have to retrace back near the start of (A) and once again we get 1220.

If this turns out to be a flat for 2 or B, wave (C) most likely will only retest the 1010 low before bouncing back higher.

Should the market pullback and take out the 1010 low, this corrective structure would be considered a zigzag and (C) may target the 950s or so. We'll address that when the time comes.


LONG TERM BEAR
This option has us targeting 1350. That assumes (C) = .618*(A).


EXPANDING (Z)
This would be the most bearish count of all since it has this entire bear market rally correction ending just about now with a truncated 5th of (Z). But, should the market move with this count and touch the top expanding trendline, guess what area that fall under?