Wednesday, December 22, 2010

12/22/10 - [11:25 AM Update]

[11:25 AM Update]


[9:50 AM Update]
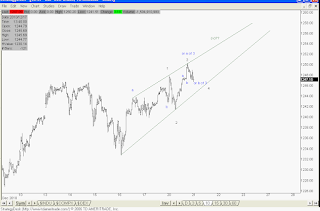
5th Wave Extension

I think this is a very good scenario playing out. See this previous post on the Golden Section to understand what the above chart implies.

If a 5th wave extension is occurring, 1293 looks like a good target. This also fits in with my reverse fib technique/confluence chart. See here for that chart

Pre Market

/ES

No counts for e-mini just a simple channel and a range is highlighted.

I believe this may have been the first time I posted this chart back in July. If you have been reading this blog for some time, you may have already seen this chart. I hadn't taken a look at it in a while until this am. Below is the most current update.

SPX

Whether or not there was any merit to the comparison, it surely panned out.

If your interested in seeing the progression of this chart, check it out here here.

I bring it back because this is an example of what I deem "outside the box" thinking. Or maybe it's just a form of pattern analysis.

Call it what you will but maybe it's relevant because I continue to see comments on blogs about how manipulated the markets are or how such and such indicator is not working, or EW is worthless, blah blah blah...

I bring this up because, maybe one should give some consideration to how popular a TA tool is and treat it with a contrarian view; meaning, if everyone is talking about it and referencing it, maybe it is no longer useful. Isn't that an argument of those who do not believe in TA, the fact that it is a self-fulfilling exercise?

Anyway, all I'm saying is, if something isn't working, rather than moan and groan about something not working, maybe we should look for another solution or a another way of analyzing the market that perhaps the majority of folks aren't doing.

Just my humble 2 cents.

Tuesday, December 21, 2010

12/21/10 - EOD Update

[EDIT 3:10 PM]

RUT

Just wanted to add my RUT count. I don't post this normally here but mainly in the Chat room since a few folks there follow it.


EOD Update


The market continues to make higher highs and higher lows and respecting this channel. The bias then must be to the upside when it comes to figuring out which of my two main counts are correct.

Fortunately both implied that at the least 1255 would be challenged so that was the easy part. Now that we are here, where does the market go?


Option 1A

This count should speak for itself. Notice the inverted head and shoulders target was met today though so something to keep in mind.

5 Min- Supports 1A

This is the internal count to support the larger chart above.

Option 1B

I still really like this count too especially the way the market began to reverse near the close and right after hitting the 1255 level, a near perfect target of the Fib confluence I pointed out this AM.

Notice that the 30 min MACD is basically on a sell.

10 Min - Supports 1B

Here's the 10 min chart I posted this AM and so far this may be key.

ED Option- Alternate Support to Option 1B

This is an alternative that would fit with option 1B so let's keep this in mind.

Once again both options are looking for a pullback. How far will help determine which one is at play.

12/21/10 - Pre Market [EDIT - 7:33 AM]

[EDIT - 7:33 AM]


I believe this ED option may still work. Wave 5 black cannot extend beyond 1255 or it will be longer than wave 3 black.


[EDIT - 7:20 AM]

WXY Option

This option is looking good. Looking for a pivot here at 1252 or 1255. Both are good Fib Confluences.


The ED option below is most likely out. The more bullish option below is still on the table.


[EDIT - 6:06 AM]
WXY Option- Fib Confluence


Hmm. Interesting. there is a Fib confluece at 1252 and 1255.

The blue Fibs represent the extension of wave b/x red to a/w red.

The red Fibs represent the extension of wave c blue to wave a blue.

Pre Market

Futures are up this AM. I have listed three options below that I will be watching today.

/ES


Channel


WXY Option

ED Option

Bull Option

Monday, December 20, 2010

12/20/10 EOD Update

EOD Update

Preferred

There are still a few options out there but after today's action, this is still the count I'm watching.

The ED I presented earlier will be applied here for minuette (v). Notice that the market broke thru the MACD trendline resistance?


10 Min

Here's a closeup of the ED. The options are it is either working on 4 or still on 3.

I don't place the alternate labels here but this structure may still just be a w-x-y as highlighted below.

Alternate

Just a w-x-y for wave b/x? For a legitimate expanded flat to exist, the market shouldn't rally above 1255 , which would make wave b/x extend a/w by 1.618 times. Any further and the odds decrease that it is an expanded flat.

Notice that the ED count and the w-x-y above potentially imply the same thing? one more little push up and it can be considered complete.