There are a few options for [Y]. Either it is one large ending diagonal or [Y] is a zigzag (a-b-c) itself with wave c of that zigzag forming an ending diagonal.
Looks like 1082-1090 is a level it is gunning for. Let's see what happens

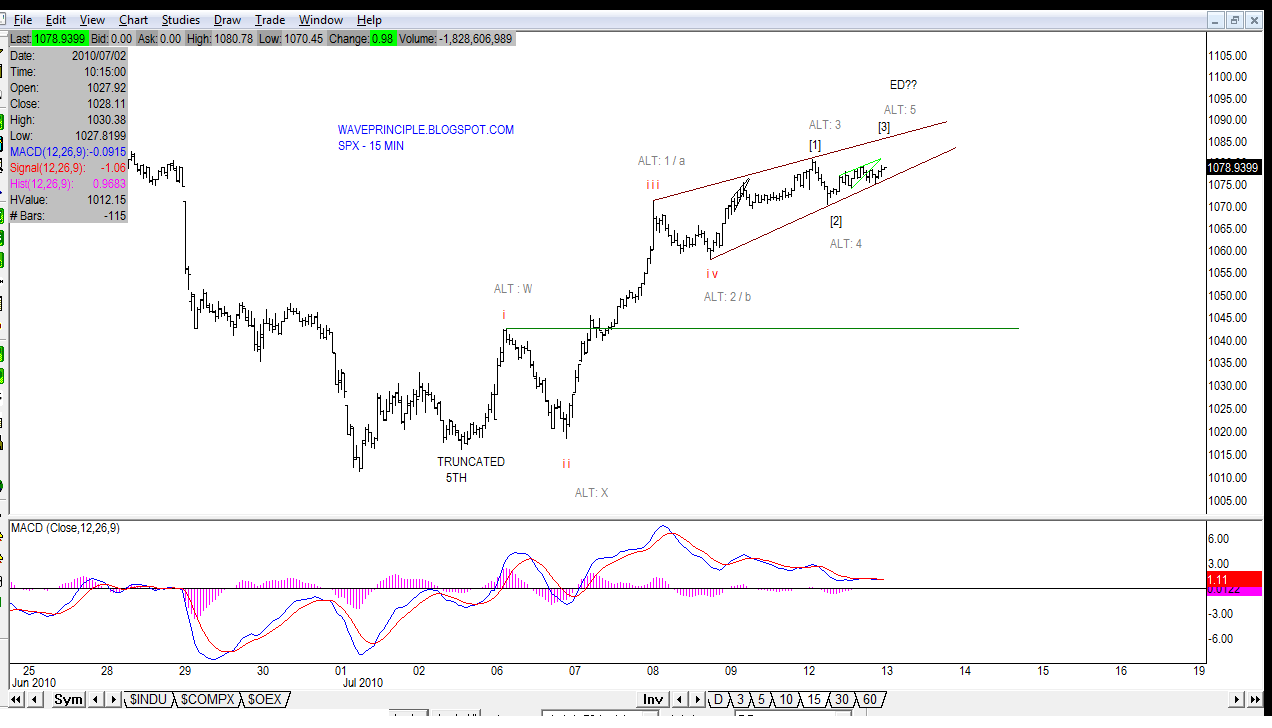
Here's a look at the 15 min chart. An ending diagonal appears to be developing. Is it the end of subminuette iii or of wave c? A break below the green horizontal line will rule out the possibility that the bounce off the 1010 low is an impulse.
As previously posted, a pullback was pending due to the 60 min MACD indicator. See here.