Perhaps /ES completes it's double ZZ overnight.
[EDIT 10:00 PM]
This is another option for this decline. This may be a more balanced option but what I don't like is wave c red of (w) green. It falls short of wave a red. Per guidelines, wave c is often the same leg as a. In this case it is only .618. Not a rule breaker but not typical either.
However, if that is what may be going on, the second wave c of (y) perhaps takes on the same ratio to a and lands at 1193. If not, it equals wave a at 1185. So we'll see.
So what is the difference between this count and the one below? Mainly the degree of the wave c down. The top chart here requires a subminuette c, which is (in length) than the minute [c] required in the chart at the very bottom of the post.
[EDIT 7:25 PM]
I just updated the 5 min bear option to better reflect the preferred count at the moment as well properly label the subwaves to the correct degree.
Is the EUR/USD due for a bounce? An hourly positive MACD divergence is surely building.
The dollar is also showing a negative MACD divergence on the hourly chart. This may fit in with the bull option or the bear alternate option calling for another push up before resuming the pullback on SPX.
[EDIT: 4:00 PM]
Here's an update to those 3 min charts I posted all day. I changed it to a 5 min interval to zoom out just a tiny bit.
As you can see from the 11/9 top there is no impulse count down that works excerpt for overlapping waves, which implies this pullback is corrective.
After popping just a tad bit at the open, the market pulled back and had thus far retraced nearly 78.6% of the rise since the Friday low. The market also closed near the center channel.

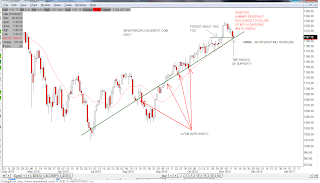
A follow up this chart that I posted yesterday. The market still found support at the intersection of the ascending trendline and top of the ascending triangle.
An inverted hammer printed today, which may signify a reversal if tomorrow a gap or long white candle can follow.
See here for more on inverted hammers.
EOD UPDATE
Ok. Last Friday, I posted that I was expecting a bounce for minute [b] to hit the top of the descending channel. We certainly got that today.
I also added that as an alternate, either minuette (a) of [b] is a possible count or subminuette i of minuette (iii), which you may have read throughout the morning with my 3 min interval updates.
At 9:13 am today, those three options were presented and as of the close, all three options remain. The first option, minute [c] down at this point carries more weight since it remains in the descending channel. But until the minute [a] low is taken out, the other two options remain.
I have a feeling minute [b] needs to go higher though just so it balances out minute [a] better and it will "look" more balanced. However, MACD at 30 mins looks like a sell signal is imminent.
One thing I will take a look at is the possibility that I may have to relabel my minute [a] and [b] to [w] and [x]. This will determine what to expect next if we do continue lower.
If it is just minute [c], then five waves down will be the structure. If [y] is actually in progress down, then we need to look for a three wave move resembling an a-b-c or 5-3-5.
I'll post more charts later.


