scw and I were briefly discussing the RUT earlier in the chat room. After looking at the count some more, I believe there was a triangle within the consolidation we saw the past two months after all.
Below is the daily picture for the RUT. Take a look a the two 60 min charts that follow. The first examines the count at the top and why I believe it should count as corrective vs impulsive (this same argument is made for SPX).
The second 60 min chart highlights the triangle that plays out to complete the entire corrective sequence from the July high.
If this is correct, this changes things quite a bit in terms of what type of bounce/rally to expect. I acknowledge that on the daily view, the structure overall looks like a five wave structure. However, one thing I am learning with EW is that W-X-Y correctives also appear as five waves from a higher level view.
It's when we drill down deeper within the squiggles, as in this case, that it is more recognizable as a corrective structure.
Now couple these counts with the one I presented for DJT below and my copper count and now it can be argued that a three wave corrective structure may have just completed today.
We all know nothing is certain. One thing that we do know though at the moment is that both counts (my corrective or the five wave decline count) calls for a bounce. Couple this with several +ve divergences that were confirmed today and the odds are pretty good in our favor that we should see a decent size rally.
The only difference is that one will be prepared should the rally choose not to stop near the 50%, 62% or 78% retracement levels. Better yet, we won't be scratching our heads and blaming "them" for manipulating this market to new highs wondering why it got there.
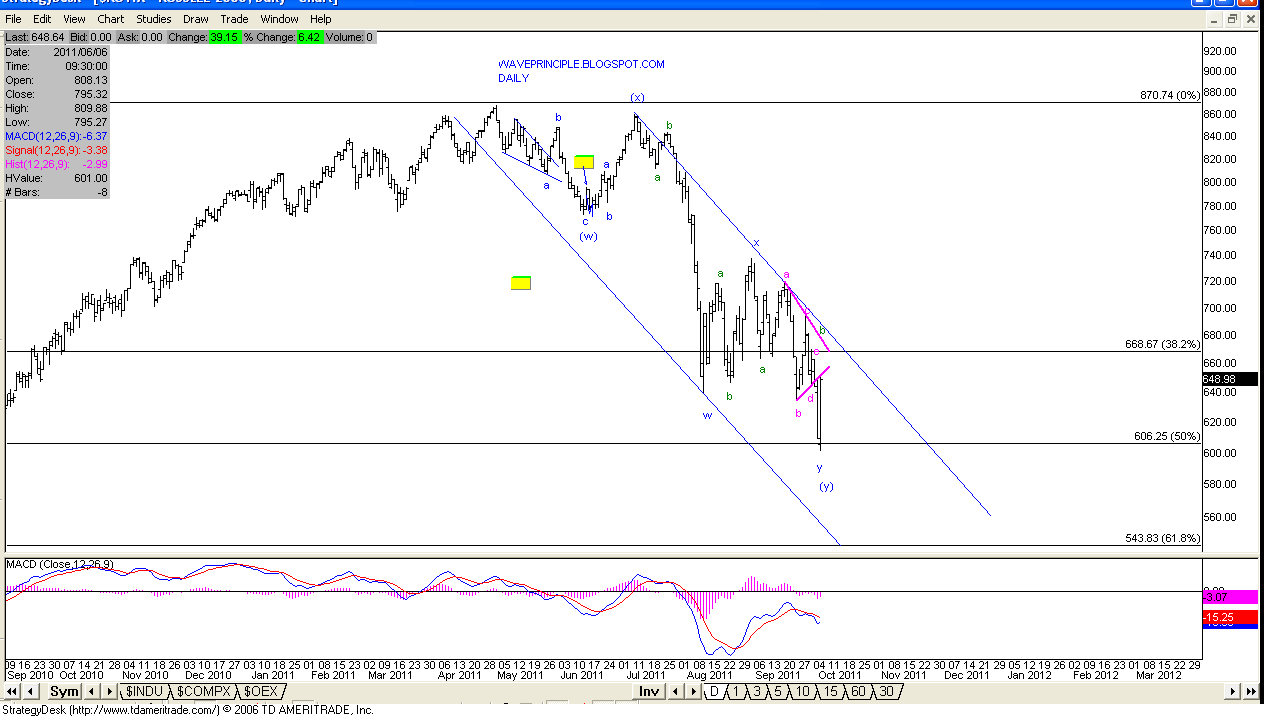 |
| RUT Daily |
 |
| RUT - 60 Min Close Up At The Top |
 |
| RUT - 60 Min Close Up At The Bottom |
 |
| SPX - Daily |
 |
| Blue |
 |
| HG |
EOD Update [4:38 PM Update]
 |
| DJT |
I would hesitate to call it a five wave move down from it's July high because wave 4 would be so bloated and so unproportional.
 |
| NDX |
See below for this.
 |
| NDX- Close up |
EOD Update
What a wild day today. That is to be expected with an elevated VIX.
Buyers and shorts covering managed to move the market nearly 50 points off the day's low.
I have modified my blue count to match the big blue and big blue2 charts below. I posted this one a few times in the chat room and feel this is the best explanation from a corrective stand point.
 |
| Big Blue |
 |
| Big Blue2 |
Should the market find a reason to rally to new highs from here it may either be a wave 3/C/Y.
 |
| Blue Count |
 |
| Daily McClellan Oscillator |
 |
| Red Count |
Notice the ALT label. Should wave B yellow have completed there, then a nested 1-2 i-ii down should be considered. Today's rally into the close would be wave ii and that would allow for more room to the upside as part of it's correction. 62% takes it to approx 1150.
 |
| 5 Min Bear |
 |
| VIX |