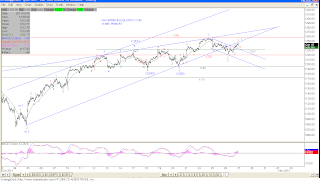
 |
| ES |
Just something to consider.
| Repeat? |
 |
| SPX - Weekly 'W' Bottom? |
For more on this pattern see this previous post.
1268 anyone?
EOD Update
Things turned out pretty much as expected in yesterday's post albeit a minor hiccup at the open as the market rallied 14 some points before finding a daily low near 1220 and then rallying into the close.
The rally off the day's low counts as three waves up so far and what may have been wave 4 into the close.
All three counts below are still in play. A 30 min MACD buy signal was confirmed today with the 60 turning up.
The bears need to reverse this starting tomorrow or it looks like the most recent high will be challenged at 1256.
 |
| Primary |
 |
| Alternate 1 |
 |
| Alternate 2 |
 |
| Battle Line |
Advantage bulls at the moment.
| SPX- 60 Min TL |
 |
| McClellan Oscillator |
The weekly MACD continues to build on its buy signal confirmation. So absent a reversal the next three days, this should be confirmed.
Notice the 80 week SMA (blue line). It currently sits at 1213. So should alt 1 or alt 2 play out, I believe it may provide a floor for the market.
A possible target before a larger pullback. That just so happens to coincide with the 200 day SMA.


