[9:10 PM Update]


This is a bullish count off the 1/7. This looks like a pretty good count. The internal squiggles count well and there are no overlaps except for the leading diagonal.
If that is a leading diagonal for wave 1 blue, an approximate 78% retrace for wave 2 down would be the next expected move. This level would be approximately 1264.
 This is an update to Option1 to reflect the bullish internal count above.
 This is an update to Option1 to reflect the bullish internal count above.
[2:20 PM Update]
Chart commentary added below and an INDU chart.
I'm still not convince a new impulse wave down has begun.
 INDU
INDU
EOD Update
Commentary to follow.
It is certainly possible a complex corrective for 4 black is still underway. However, I do show a possible wave 1 up as a leading diagonal for wave 5 black.
The chart below highlights a few more options that may be going on up here.
 Combo Corrective
This chart highlights several options.
1. Wave 4 black complete from the option 1 chart and the bounce on today's low was wave 1 of 5 black.
2. Blue Labels - A triangle forming as part of a combination corrective. Wave a of b formed off the bounce.
3. Red labels - A larger triangle that began on 12/31. The bounce off the day's low was wave a of d.
4. Green labels - As part of a larger w-x-y possibly targeting 1255 or may just be complete along the lower ascending trendline to complete wave 4.
All options imply a pullback is in store and shouldn't exceed the lower ascending trendline except for option 4.
 Wave 3 Extension
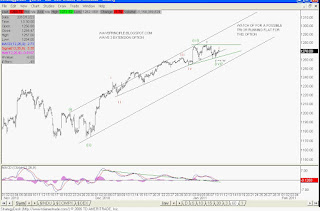
Here is the wave 3 extension option. Wave (iv) is complete or nearly complete.
Chart commentary added below and an INDU chart.
I'm still not convince a new impulse wave down has begun.
 INDU
INDUEOD Update
Commentary to follow.
 Option 1
It is certainly possible a complex corrective for 4 black is still underway. However, I do show a possible wave 1 up as a leading diagonal for wave 5 black.
The chart below highlights a few more options that may be going on up here.
 Combo Corrective
This chart highlights several options.
1. Wave 4 black complete from the option 1 chart and the bounce on today's low was wave 1 of 5 black.
2. Blue Labels - A triangle forming as part of a combination corrective. Wave a of b formed off the bounce.
3. Red labels - A larger triangle that began on 12/31. The bounce off the day's low was wave a of d.
4. Green labels - As part of a larger w-x-y possibly targeting 1255 or may just be complete along the lower ascending trendline to complete wave 4.
All options imply a pullback is in store and shouldn't exceed the lower ascending trendline except for option 4.
 Wave 3 Extension