Thursday, November 3, 2011

EOD Update [9:53PM Update]

[9:53PM Update]

Just playing around with the count and structure. This is an interesting one that counts legitimately. We'll see.

30 Min

60 Min


EOD Update

Yesterday's EOD Update is a good example when most of one's EW counts (primary and alternates) point in the same direction it's not a bad time to take a bet in that direction or maintain a position previously held.

Granted the counts alone were not the sole reason, I did point out the 30 and 60 min MACD setup as well.

Anyway, the market followed through and now we need to determine if wave iii is nearing completion on the primary or if wave (B) is complete for the alternate.

I eliminated alternate 2 so the counts are a little easier to manage again.

30 min- Primary
This count has the market stair stepping higher in the channel. Obviously pattern-wise that still fits as a bear flag so one must remain vigilant with that, especially since the alternate count below may have completed.

60 min - Primary
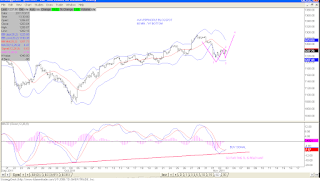
If you are wondering how the 30 min fits into this picture. The 60 m MACD looks like it wants to cross up through the zero line.

5 min - Alt1
It is very possible that an ED is forming up top to complete wave c of y of (B) or it is already complete.

VIX- Daily
The VIX managed to close above 30 and formed an inverted hammer right at the back test of the descending TL it recently broke out of.

The daily MACD buy signal was confirmed today, however must watch to see if this is short-lived especially with the close below the daily 20 SMA. (I forgot to correct this statement in yesterday's EOD. I wrote "sell signal" when it should have been "buy")

Wednesday, November 2, 2011

EOD Update

EOD Update

The hourly MACD crossed up and triggered a buy signal into the close. The 30 min primary below still has the market in a confirmed buy signal as it crawls up the channel.

I think I'm 50/50 on expecting one more leg down, however, I believe at minimum all three options below may have the market testing yesterday's gap at 1251 first. Pattern-wise, we must still respect the bear flag plus there was a daily MACD VIX sell signal triggered today.

The 30 min primary is the more bullish of the three and it is indicating a gap and go up starting tomorrow.

I mentioned this in the chat room before I left for the day mainly because the market was hovering just below the 20 SMA on the 60 min which triggered a MACD buy signal into the close. Therefore I think the market will gap over this tomorrow at the open.

30 Min Primary

5 min - ALT 1

5 min - ALT 2

60 min - Bollinger Bands

Tuesday, November 1, 2011

EOD Update [3:52 PM Update- Primary change]

[3:52 PM Update- Primary change]

I hate to keep tweaking the counts but at the moment, I think this may be the better count. I have flip-flopped the previous primary with the alt at today's EOD update.

Upon looking at the squiggles again, I believe we may have 7 waves down to complete a corrective wave vs 9 to complete an impulse with an extension.

The MACD on the 60 min below will be telling should it turn right at the TL support.

Don't get me wrong, the 5min alt 1 and 2 counts I presented at 2:54 PM are very much valid but in the end, all three counts are looking for a bounce sometime tomorrow.

So for now, it may be better to look for a Fib target above and sort out the waves on the rebound to come.

30 Min- Primary
I'll certainly be keeping an eye for a backtest of the broken TL.

60 Min - Primary
Let's see if price will climb back into the channel.


[2:54 PM Update]

Upon examining the squiggles a little more, I think these 2 alternate views should be considered. Both press for a bounce at near the open.

ES has an hourly MACD buy signal at a key Fib retracement (38%) so let's see what happens overnight. Still watching that head and shoulders pattern to. ES may target 1250.

5 min - ALT1
5 min - ALT2
EOD Update

As much as I want to believe that the 10/4 low is the Primary wave 2 low, there is just no way to legitimately count five waves up off the 10/4 low.

With today's bearish follow through, the last bullish impulse count up has been eliminated and I have now place the alternate count as the primary. This count has an intermediate wave [x] underway. The alternate to that is that wave [x] completed at the10/27 high.

At the moment, the market is in the process of completing five waves down and closed the day just above the 20 day SMA.


5 min
Either wave 5 is underway or a wave c bounce tomorrow is in store for a wave 4 flat.

Daily Primary
Here's the revamped count again to show the alternate as the new primary. Notice it is very possible to count wave [x] as complete as well.

The daily MACD is starting to roll over and the weekly may start to break down as well.

Please don't confuse this change of count as a reversal to the charts I posted over the past two weekends. This new primary may still accommodate new highs to come.

60 min

Looking for the completion of the first five waves for wave a of x green. Let's see if MACD bounces at the TL. That may signal the start of at least wave b of x up.

Daily Bollinger Bands
The market took a break right at the 20 day SMA and near the 38% retracement. With five waves almost complete, one would expect a decent size bounce to follow.


Still watching this analog. So far the 50 week has rejected the backtest.

TNX - 10 Year Yield
Shame on me for not following up on this. I had been tracking the count and spotted five clean waves up the other. In fact I was commenting on the beautiful adherence to the guideline of alternation between wave 4 and 2.

Anyway, so far looks like five waves down or nearly five waves down to the 62% retracemement level. I'm looking for a wave b bounce before one more leg down.

Pre Market Update

Pre Market Update


Looks like the bears are gonna continue the party. Yesterday in my haste to get an update out before trick-or-treating with the kiddies, I forgot to post the more bearish nested 1-2 i-ii option as mentioned in the chat room (4:25). I suggested a gap and go down, which obviously now apparently is the case with ES down -23+ points.

The 13 day EMA at 1237 may play a role here today since it has supported all pullbacks of the 10/4 rally since 10/7.

But I will also refer back to the chart labeled "repeat", which may serve as an overall guide. Notice in 2010, the market just slammed ride through all the MAs.


ES
ES broke below the channel overnight.

5 MIN - BEAR
Here is the bearish nested 1-2 i-ii option.
REPEAT
Watching 1237 first.


Based on the counts I have been tracking, the bullish case may have to take a backseat at the moment. 

My longer term alternate may have to come to the forefront. The chart above is the two potential paths I see for this path.