Thursday, May 20, 2010

5/20/10 - SPX EOD : Bears In Control [9:28 PM PST Update: Euro on Fire]

[9:28 PM PST Update: Euro on Fire]


Remember this chart from last night? Let's see what happens at 1.27. That is the head and shoulders target.

The green line is the very large neckline I posted on a 5/16. See chart here for the larger overall count.

Apparently SPX E-minis is reacting to this move as well. How does it fit into the count. See below. Either a wave C of iv up tomorrow at the open or maybe we bottomed. But hey it's OPEX, should be interesting.


Clearly the bears are in control; for now. The 21 day EMA is below the 34 EMA and both are just about pointing straight down and the market closed well below the 200 day SMA.

Above is my bear count. 1050 SPX looks like a minimum target at the least, which based on the count, would complete minuette (iii) of minute [v]. The alternate is that this is only minuette (iii) of minute [iii].

Because I can still show a bull count along with the bear above, I am still waiting to see a death cross, 50 under 200 day SMA, before truly turning on the bear case. Keep in mind, even though I show a bull count, the bull count still allows for more downside to come so both are worth watching.

All I can say is just remember July 2009. Many were convinced that P3 was here. Additionally, it was like overnight the headlines on the financial news websites became very bearish. Just something to keep in mind.

So with that being said, here is my bull count.


I still consider the move down off 1219 as a 3 wave structure. I made some changes to the degrees but show the panic low as minute [a] of Minor B. The rally from there to 1173 is minute [b] and now we are working on a 5 wave structure down for minute [c]. Notice how this 5 wave structure down also matches up with the bear count down?

So though one may feel bearish (myself included), just keep in mind the potential for this bull count.

Here's another chart I've posted in the past showing the golden cross back in Jun 2009.


So the game plan for now is that the bear and bull count is looking for 5 waves down. So from a trading perspective, nothing is different. Eventually a bounce is going to occur, wave 2 if using he bear and wave 1 if using the bull count.

The difference in those two waves will tell us the story. Wave 2s are usually zigzags (a-b-c three wave structures) and are sharp. Wave 1s are just simple impulse (5 wave structure) waves. Hopefully when the time comes, the wave structure will help tell the story along with the MAs at that point.

Oh, almost forgot this other potential count that still works:


GL!

Wednesday, May 19, 2010

5/19/10 - SPX EOD [8:56 PM PST Update : EUR/USD]


Another one of those whipsaw days. These waves continue to look overlapping to me, which makes me automatically think of 3 wave structures.

Above I have put together a bull and bear count, which I think works well. Both are implying the same thing, A little more downside to come and then a sharp bounce is in store. How high that bounce goes will detemine if the bears are in charge or if the bulls are.

I interpret the structure off the 5/13 top as a possible ending diagonal. The waves down just do not look like clean impulse waves to me. The structure itself is starting to wedge and also appear to take on a 3-wave pattern. This is very indicative of a potential ending diagonal pattern, especially because it fits both the bear and bull counts. You see a 5th wave or a final wave in a zigzag (a double in this case) may end with an ending diagonal.

The other option here is that the move off the top at 5/13 may just be a double zizag. I have a few options for that as well but will address that later should the pattern play out.

That is all for now. I'll probably post more charts later.
  
[6:15 PM PST Update : E-Mini Diamond Pattern]


Hmmm. A second time a charm? This looks a little more proportional this time. So far it found support near the lower trend channel as well and consolidating around the gap.


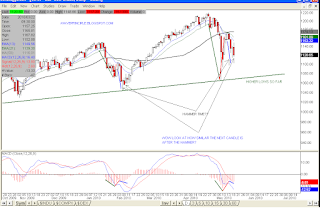
As the chart above indicates, the market dropped to it's 200 day SMA and bounced from there as expected and resulted in a hammer at the close. Let's see if there is a positive confirmation tomorrow. There are some overhangs above that will provide resistance. The 21 and 34 EMAs have certainly curled over so the trend is currently down near term. How much longer is the question. Don't forget, we got the same action back in February only to see the market march back up to new highs.

As I mentioned a few weeks ago, I'm watching the 50 and 200 day SMA before I switch on full bear. Until then this has been a good market to trade.


This count is also still progressing along. Posting updates everyday until it doesn't work anymore so keep an eye on it.

[8:56 PM PST Update : EUR/USD]


The Euro looks like it may have complete an impulse down and working on a correction back towards the neckline above. Click here for a larger view.

Tuesday, May 18, 2010

5/18/10 - SPX EOD [10:20 PM Update: E-Mini; Completed 3 waves down?]

 SPX - 60 MIN PREFERRED


SPX - MINOR C ENDING DIAGONAL OPTION

SPX - 60 MIN BEAR COUNT

SPX -CANDLES

SPX - 60 MIN BOLLINGER BANDS

Today was definitely a day for the bears. That inverted head and shoulders is off the table, however that diamond pattern may not be. It just may be getting a little larger. 

The market attempted to re-capture 1150 but was unsuccessful today.  I still believe we are seeing a series of 3-wave structures up and down creating this range bound action.  

My first chart above is my preferred count. I have minute [i] completed with the pullback working an a-b-c structure. 
My bear count and alternate count (Minor C ending diagonal) are above as well. 

The fourth chart is something I have previously posted. I have compared the Feb hammer with the hammer that printed yesterday. Though a confirmation today of that hammer would have strengthened the case for the bears, notice the candles that printed following both hammers. Again, without confirmation, this cannot be considered a reversal. 

The last chart is a 60 minute Bollinger Band chart. The bands are starting to tighten so it is possible a move is coming. I would wager that that may be up. We'll see. 


 [3:30 PM UPDATE: BEARISH HEAD AND SHOULDERS]


I updated the bear count above. There is a possible bearish head and shoulders in the making. It would fit in well with a wave 3 down. Notice that wave 3 =1.618*1 at the H/S target. Hmmm....


 [9:00 PM Update: 5 MIN Chart]


[10:20 PM Update: E-Mini]


5/18/10 - SPX E-Mini AM Update [6:15 AM : Fractal Update]

[6:15 AM : Fractal Update]

The more I look at the chart above, the more I believe that some form of self-similarity is playing out. So far the first two fractals, green and red have retraced their previous swing lows by 61.8%. I'm thinking the purple fractal does the same towards 1150 and then resumes lower to complete the red fractals pattern.

We'll see.

SPX E-Mini

I'm not very familiar with the diamond bottom reversal pattern but Cobra mentioned this last night on his blog. I took that suggestion and incorporated it with what I believed to be an inverted head and shoulders in the works. 

I initially posted this chart last night. So far so good, at least from a inverted h/s standpoint. I don't know if the diamond bottom applies but either way, both indicate a potential an 1161 target (1170 on cash). 

We shall see.