Friday, October 17, 2014

10/17/14 - AM Update

[12:41 PM] - A new inverted H/S target (1978ish).

12:41 PM - 5 Min 


[11:55 AM] - I removed the purple labels since it was invalidated. We are left with red and blue.

I'm having a hard time counting an impulse for blue off the wave c low. I tweeted the other day tho that an extended third wave could be in the works should the inv H/S play out. So we must be mindful of that.

However, given all the volatility, I'm placing a day trade short bet here that wave {iv in fact completed today and that wave {v may be underway.  Stop is above today's high. We'll see.
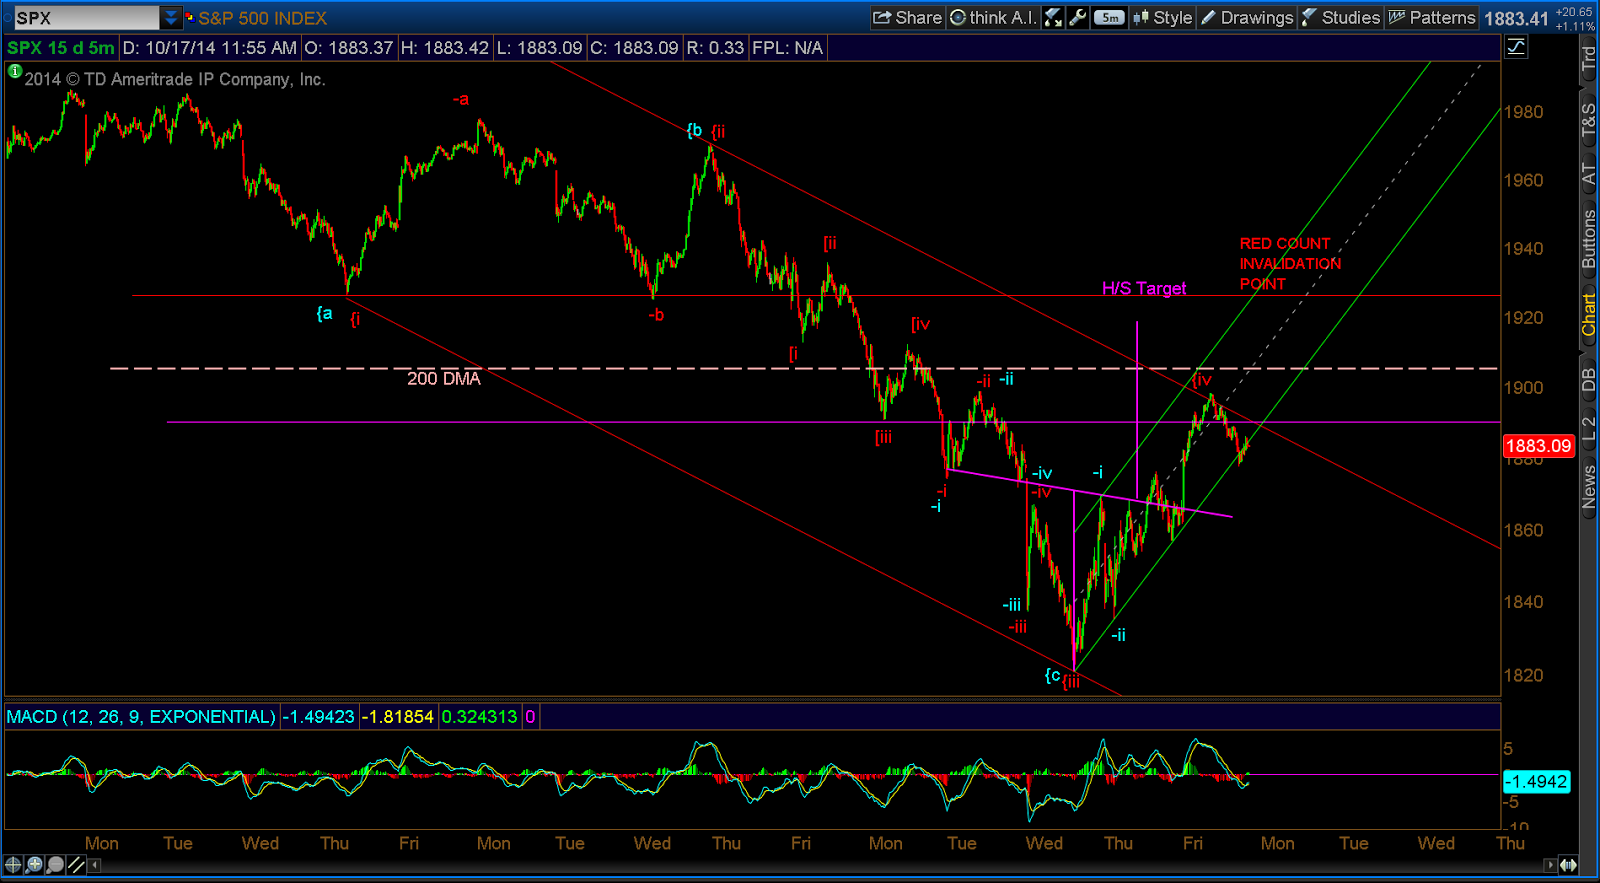
11:55 AM - 5 Min 


[11:01 AM] - Remain nimble folks. Wave {iv may be complete. Rejected at the upper end of the descending channel.


11:01 AM - 5 Min


[7:37 AM] - The purple count is out. The red count invalidation point noted on the chart at the H/S target. I'll take 50 points from yesterday. I'm out of my trade.

7:37 AM - 5 Min


[7:05 AM] - Yesterday's trade is looking good. The inv H/S appears to be playing out.

Being nimble has been great. The purple count has almost been invalidated. We'll see if this is targeting the 200 DMA.


Thursday, October 16, 2014

10/16/14 - EOD Update

Not much to add here. The options presented yesterday are still on the table. I pointed out the potential inv H/S earlier today. I took a trade on this earlier. We'll see if this can backtest the 200 DMA.

5 Min 

10/16/14 - AM Update

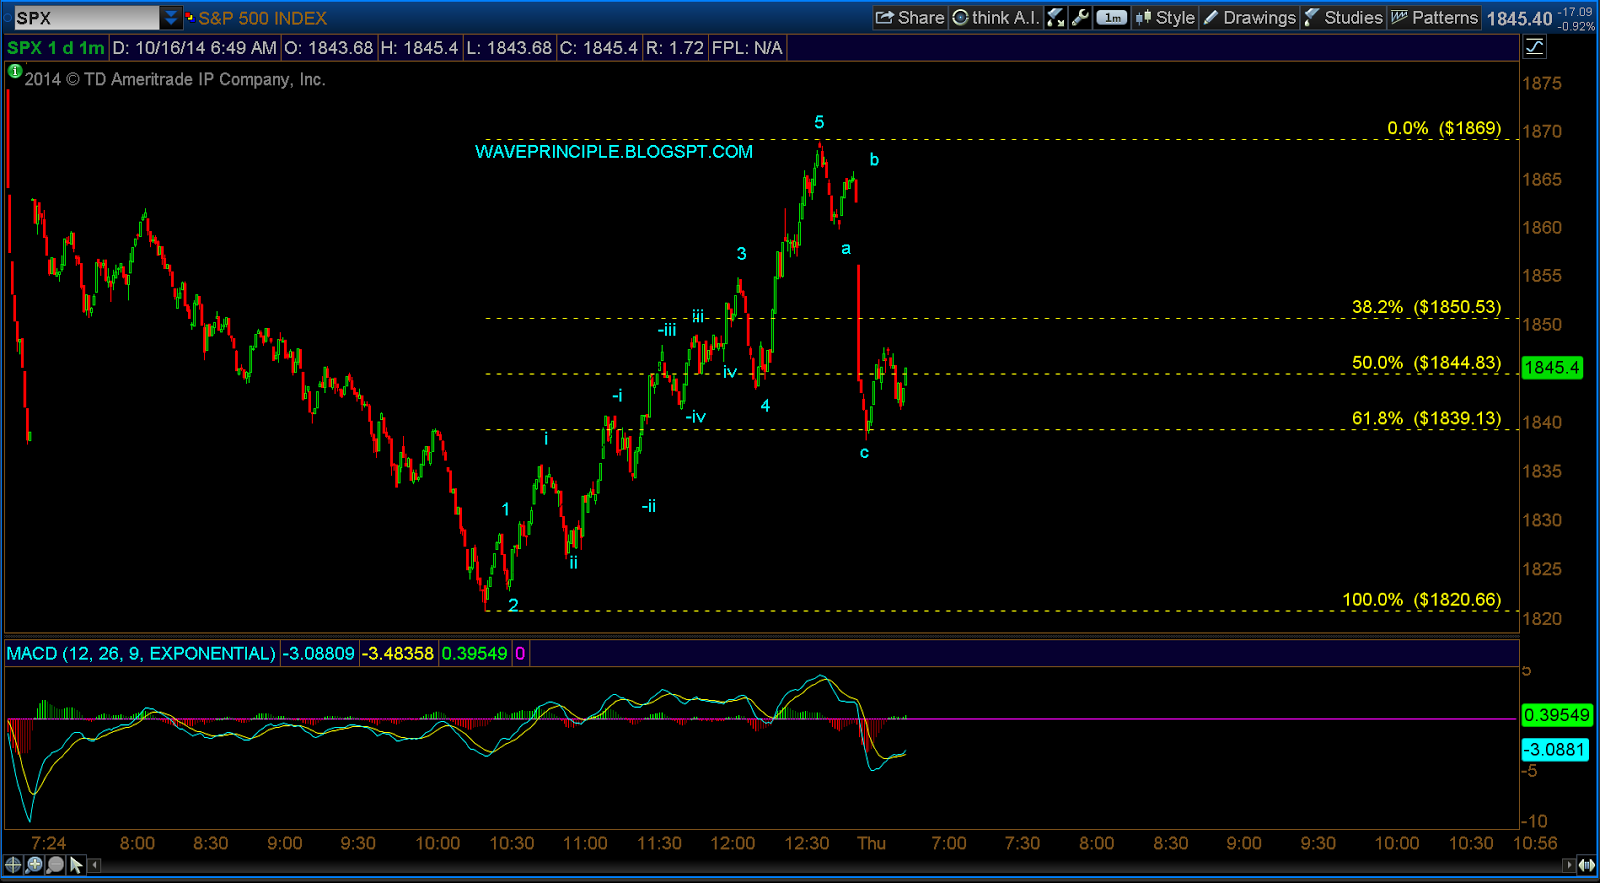
[6:49 AM] - We'll see if wave c is complete. Taking a shot to trade this.

6:49 AM - 1 Min 


[6:11 AM] - With futures down 20+ pts at the moment, we'll see if wave c holds near 1839ish. If not, we'll assume wave [iii purple is underway.

6:11 AM

Wednesday, October 15, 2014

10/15/14 - EOD Update

[1:56 PM Update] - Adding the 1 min chart. So far, looks like five waves up off the day's low.


1:56 PM - 1 Min


[EOD Update] - What a wild day. Nimble traders made some money.

The bear's formula of selling all rallies appears to be working over the past several days. If the bulls want to stop the bleeding, today was their chance to do so. 

I have several options (three) on the 5 min chart. 

Blue - Favors the bulls and calls for a completed zigzag. On the daily, this equates to a completed wave w or possible larger degree wave a of a larger flat or triangle for wave (4). 

Red - Continues to subdivide with an extended wave that will take on a 13 wave count from wave {ii red. 

Purple - A variation of red that also is looking for subdivisions down. 

5 Min 
On the 60 min below, the third leg down hit 1.618* the first nearly perfect before the bounce. Note the purple lines, so far this is only three waves down. The bulls need to clear 1926.03 to create an overlap into the first wave.

60 Min 

On the daily below, I tweeted earlier that a massive hammer may form and that is what the bulls created. Note that the retracement also has entered the territory of the previous wave 4, which I had labeled as a triangle.

So if the market is truly in a wave (4), price-wise, the level has been met. There is room to trade down to 1815 though.

Time-wise is another story. So what I'm speculating here, as posted in the AM, is that we may be trading in a range from 1825- 2020 over the next several weeks.

Wave (4) has the option to turn into a flat or a triangle, which would be a traders dream.


We'll see what the next few days brings. Sell the rallies or have we begun to trade in the 200 point range?