[7:57 PM Update]
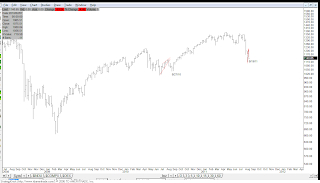
Just something to ponder that I thought was interesting. Notice that after the 4/2010-6/2010 decline, SPX put in a Leading Diagonal. Here we are a year later and another rising wedge, which is potentially a LD is here again.
Notice specifically where both pullbacks from the LDs fall? Very close to 1 year.
I read that Sept and Oct are typically bearish months on a seasonal basis. Last year obviously was not the case but we know why.
Others are shunning any type of QE3 or at least it's ability to rally the markets. I guess we will see shortly.

Weekly

Daily
EOD Update
What a day to be on the short side. If you were positioned for it, congratulations. Now the million dollar question is, is this the end of the pullback?
The ending diagonal that formed near the close signaled to me that a bounce,should follow through tomorrow and at minimum represent a wave c/y as part of a flat. If you're leaning more bullish, this could be the start of a move to test the 20 and 50 day MA, which I believe should still occur.
I have made some adjustments to my counts in hopes that it will be easier to follow what my thoughts are near term and longer term.
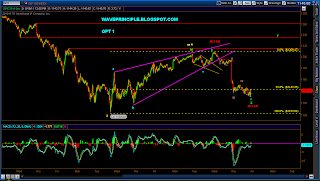
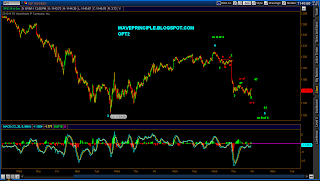
Below you will see two daily charts labeled OPT 1 and 2 with their corresponding 5 min charts. For the most part, they both are looking for a completion of a wave 4 and/or 5 down.
I won't be surprised if the market recovers half of today's loss tomorrow to end opex week.

OPT 1 - DAY
With the above, 4 yellow may be complete and today's selling is 5 yellow. However, below on the 5 min chart, 4 yellow may still be in progress.

OPT 1 - 5 Min
Today's selling was either the end of wave X green or 2/b of 4 yellow.
iv pink may also turn into a flat so keep that in mind.

OPT 2 - Day

OPT 2 - 5 Min