[2:04 PM Update]

Weekly
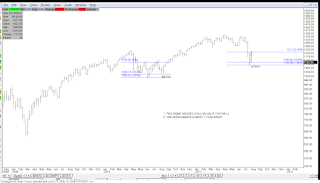
Here's an example on a weekly basis. I actually was watching this and posted on it back on June 11, 2010. See this post.
EOD Update
At the time, I was viewing it on a daily chart. I believe the weekly plays out better. The only caveat to this is the test of the low was not a lower low. I'm not sure this is an absolute requirement or as long as there was a 'near' test.
Looks like we had some follow through selling today. Based on the charts and counts below, I feel fairly confident that this leg down is complete. If not just a few more points lower to complete what I believe is five waves down from the 8/17 high.
I believe we should see a bounce as early as next week. Opt 1 and 2 remain and depending on which one is playing out will determine how high a bounce.
I think 1155 is fairly reasonable and would be the minimum bounce target should the more bearish (opt2) count play out.


Opt 1

Opt 2

5 min
The 5 min squiggle count showing what appears to be five completed waves. Of course there is room for a little more but I think it's pretty much there.


Here's something to think about if the market completed a larger degree five waves down from 7/7. Obviously a higher Fib retracement would push the market higher even for a bounce.


Daily Bollinger Bands
We need to keep an eye on this potential 'W' bottom pattern combined with the Bollinger Bands. In summary a second lower low that is within the lower Bollinger band would satisfy this pattern. Notice that the first low on 8/9 pierced outside the lower BB?
The market is now working on possibly testing the 20 SMA (currently at 1219) before making one more test of the low. Should that second test of the low stay contained above the lower BB, this could be setting up a bullish 'W' bottom.
Something I posted in the chat room last night. Just something else of interest.
Almost a year ago the market rallied in a wedge after the 4/2010 correction. The wedge was retraced 778% before resuming it's march higher into the QE2 announcement.
I find it interesting that a year later we are nearly in the same predicament. Of the 5/2011 or 7/2011 correction, the market rallied into another wedge. Since then it has also sharply retraced this wedge approximately 78%.
Now given that Jackson Hole is next week and QE3 is talked about or not talked about (I don't know I really haven't been following this. All that matters is that the Fed is meeting next week just like it did last year after announcing QE2).
We also have wave counts both bearish and bullish bias looking for a bounce, as well as the potential W bottom, I think there is a good chance we see a decent sized bounce starting next week.
Just something to chew on over the weekend. Have a great one ya'll!
