Wednesday, August 31, 2011

8:17 PM EOD Update

8:17 PM EOD Update


Coming up against the 62% yellow Fib fan. Will it act as resistance? It is currently at 1236.

2:32 PM EOD Update

Now that I post this head and shoulders pattern, the ED option is still very possible. Should the market selloff to 1183 over the next day or two, I believe I may still draw out two converging trendlines.


15 Min


In case ya'll missed this channel chart in the chat room that I posted earlier today. It helped ID the end of this move for today.

2:07 PM EOD Update


Here's the 30 min chart with the near term options I have been pointing out. I believe I can say with a fair amount of confidence that three waves off the 8/9 low completed today. What they represent, however, is still open for interpretation. Below are my top three:

1. Red Labels - A W-X-Y counter-trend rally completed to form wave (B). Near the end of the day a nested 1-2 i-ii formed for the beginning of wave (C).

2. Blue Labels - An A-B-C counter-trend rally is nearly complete with wave 3 of C ending today and wave 4 of C beginning near the close with a w-x. Once this is complete, possibly near the 1194 level, a fifth wave up should be on tap targeting the 1250 level.

3. Green Labels - Wave b of a wave (B) triangle completed today.

Notice all options call for a pullback towards a minimum target of 1194. One thing to note is that should option 2 play out, the wave 4 targets typically fall back towards the previous wave 4 of the previous trend.

In this case, that would be within the triangle range of wave 4 red of 3 blue. That range is actually about 1212-1195. With today's dip into the 1209 range, that guideline has occurred. So it is possible we may have seen the wave 4 blue low, but it may just trade sideways within the range to alternate with wave 2 blue so something to keep in mind.

Note also that I previously had an option for wave C blue to turn into an ending diagonal. That has since been removed because I don't believe a retrace will occur that is steep enough to fall back into wave 1 and still form a pattern that wedges. At least I don't think that is likely so I removed it for now. Should the bottom drop tomorrow though, then it may be possible.


1:52 PM EOD Update

As I posted in pre-market this AM, this was the count to watch and sure enough five waves completed up out of the triangle.

I haven't had a chance to drill down the squiggles but I think a nested 1-2 i-ii down may be in the works. If not, a w-x-y with y down beginning at the close. More on that later. Need to run for now.


6:12 AM Pre-Market Update

The market cannot exceed 1228 or the ED as I have counted below (30 Min) will be invalidated. Should the market exceed 1228, the 5 min chart would provide the next best count.


30 Min

5 Min

Tuesday, August 30, 2011

EOD Update [5:50 PM Update]

[5:50 PM Update]

Just a chart I posted in the chat room earlier.


EOD Update

I am liking the wedge at the moment. The market really appears to be building one at the hourly and 10 min levels.

By the close, I show an ED forming at the top for 5 yellow on the 10 min chart to complete what is wave 3/c blue on the hourly.

The pullback into the close indicates to me we should expect to see another degree wave 4 for the hourly ED.

Granted, today's high of 1220 may also qualify as the end of a zigzag off the 8/9 low, however, I think with the W bottom and Adam and Eve double bottom patterns I have highlighted being confirmed for a second day, I think there is potential for a little more upside.

As I have stated in the past, I was expecting a test of the 50 day SMA and if anything possibly a test of the upper daily BB, which is currently at 1246.

Need to run for now. Will post more later.


Monday, August 29, 2011

EOD Update [2:25 PM UPDATE]

[2:25 PM UPDATE]

Let's keep this option in mind as well should the market find itself moving in an indecisive fashion.

Below I also forgot to mention that the Adam and Eve Double Bottom most likely confirmed today as well.

EOD Update 

I guess you can say Saturday's post was correct. We now have the SPX, DOW, RUT and COMP all above their 8/17 reaction highs, which invalidates the large triangle as suspected.

The primary count I am watching now is

SPX - 10 Min

Off the 8/22 low, I see a minimum of three waves up. As you can see there are a still several options at play. For now, I'm gonna say that wave 3/c blue completed into the close in what was an ending diagonal.

As you can see I left room for the completion of wave 3 yellow. Should a five wave impulse be forming, the market should not pullback into wave 1/a blue at 1190.68. However, should this overlap occur, we must not rule out a much more bullish nested 1-2 up either. I'll address that if need be.

I believe the market is working towards the 1228 level with a potential to challenge the 50 day at 1259. See the Bollinger Band 'W' bottom below.


SPX - 60 Min

Here's the hourly view. 

SPX - Daily

And the daily view.


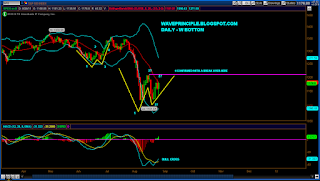
Daily Bollinger Band - 'W' Bottom

Looks like step 4 of the bottoming process was confirmed today. Should this prove to be correct, a move towards the upper band should be in progress. This lines up with a test of the 50 day SMA.

SPX - Monthly

Longer term, a close above 1179 by the end of the month can be viewed as constructive. Two days from now a close above 1179 will find the market above the 50 month moving avg after surviving a test of the 200 month and backtest of a long term trendline.

Saturday, August 27, 2011

The Triangle Breaks Up [8/28/11 8:23 PM Update]

[8/28/11 8:23 PM Update]


With ES up 8 and change tonight, I wanted to explore the fib extension targets for wave (iii) should ES hold and this gaps up at the open tomorrow. Wave (iii) makes a nice target at 1213 if it's 1.618*(i) and 1241 if 2.618*(i). Notice both Fib confluences.


Will see several hours from now if the mid-channel contains this move up. 15 min MACD appears to be building a negative divergence.


[8/27/11 Update]
I believe the odds are greater that the market will break up and out of the triangle that many analysts are watching, which implies either: 1. A larger degree wave 2 bounce is in progress 2. A wave 4 flat is in progress or 3. The correction is over and on to new highs.

The transports clearly sports five waves down with a lower low for wave 5 and an hourly MACD positive divergence to boot. To me this is telegraphing a much higher bounce is in store and would imply that SPX and others most likely will break up and out of their triangles.

Transports

SPX

All bets are off for the triangle if the market should rally over 1208.47.

SPX - 5 min

Here's a 5 minute chart showing five clear waves down off wave 4. Wave five in this case for SPX truncated. Again, the transports made a lower wave 5 here.

A nice bounce so far off the mid-channel.

Bollinger Bands - Daily

I don't believe this rebound is a wave 2 of 5 either because of the confirmed daily MACD buy signal so I'm going to presume that 1208 will most likely be taken out.


And last but not least. Anyone consider this option? Would be a great way to fool everyone.

Friday, August 26, 2011

3:48 PM EOD Update

3:48 PM EOD Update

I'm not sure where all this bearishness came from all of a sudden but this is what the primary count would project to once wave B yellow is complete. 


3:14 PM EOD Update


I believe the primary count is that a large triangle is forming for wave B yellow.

w5 min

I believe wave C of the triangle is nearly wrapping up. Early next week, I'm expecting a tiny pullback to wrap up wave x pink of Y blue.

A final wave y pink of Y blue either terminates on the inner blue triangle TL (see below) at 1185ish or pushes higher to the larger red TL near 1200. This would complete a complex wave C.


Primary Count - SPX

As stated above, I'm looking for wave C of the triangle to complete.
ES

Notice that ES looks like it may be complete or very close to completion. However, cash looks like it has a little more to go.

First Alternate Count

Should the market rally beyond 1200, I believe the next viable option is that wave c of Y launches towards 1228ish. It either accomplishes this with a simple impulse wave for c of Y or all of Y is turning into an Ending Diagonal. We should have more clues later next week.

I like this count almost more than my primary due to the bullish daily MACD configuration. However, because price still remains within the triangle trendlines, I will interpret it as such until either TL breaks; up or down.

13 Week EMA, 80 and 200 Week SMA

The market rally back above the 200 week. The 13 week EMA and 80 week SMA look like attractive targets.
W Bottom

I'm still tracking this. Again, I think the confirmed daily MACD buy signal is telling us to expect step 4 to take out the 1209 level.
Second Alternate

Should the market continue to remain indecisive and trade within the trendlines, we need to be mindful of this option as well.


3:14 PM EOD Update


This is something I'm thinking about here among a slew of options. I'll leave it at that for now and present my current primary counts later.

5:51 AM Update

5:51 AM Update

3 Min

After looking at the squiggles one more time, I made a slight adjustment to the count from yesterday. There's really no difference here in the outcome other than the technicalities in the labeling.

Per this count, one more little little down would be expected for wave c of y of c/y. Some targets are :

c=.62*a = 1152
c=a = 1148

The alternative to the count though is if c of y is still forming an ED. If that is the case, the drop at the open would be wave 3 of c. If this is an ED, this third wave down cannot be greater than wave 1.

The wave 1 length is 11.28 pts. Wave 3 is starting from 1159.91 so it cannot extend beyond 1148.63 (1159.91-11.28).


5:23 AM Update
We will know shortly if this is a wave d or if there is gonna be another push towards the upper TL which is approximately at 1180.

Thursday, August 25, 2011

EOD Update

EOD Update

5 Min

This is the primary count. I have wave y pink wrapping up in an ED within a larger falling wedge.

Once this is complete, I'm expecting a push up in a wave 3/c higher. Should my primary for B yellow turn out correct as a zigzag up, this leg should take the market past 1200 and eventually complete the impulse for wave c up near 1224.

However, should it only take the market up to 1200, see the triangle option below.


The bigger picture primary.


Here's the isolated view of that triangle for wave B yellow.

W Bottom

This pattern is still developing and remains on track. The big question now is what step is it in? Did it just complete step 2 ( I believe that completed on 8/17) or is step 4 in progress. Perhaps the daily MACD confirmed buy signal provides a clue.


11:07 AM Update

11:07 AM Update

9:27 AM Update

8:30 AM Update

10 Min SPX

7:50 AM Update


Wednesday, August 24, 2011

EOD Update [4:50 PM Update]

[4:50 PM Update]


Looking at the 2:37 Update again, I added the alt labels. A move back below blue 4 would confirm the alt labels.

[3:01 PM Update]


Ok. I lied. Here's the triangle I was referring to below under the daily Opt 1 chart for wave B yellow. We'll see. 

[2:37 PM Update]

SPX 15 Min

This is a 15 min chart using Strategydesk, which I prefer to use when counting squiggles. this may be the correct interpretation off the 8/22 low. A wave 3 is extending in this scenario.

EOD Update

I say today was a bullish follow through to yesterday's rally. Though bearish counts still exist, I think the edge goes to the bulls shorter term.

I thought today's move would be capped by the 13 day EMA, however, the market closed above it. A 1 day close does not constitute an immediate change in trend though. I'll be looking to see if the market can remain above for a few more days.

So far my count and the other bullish patterns developing is pointing towards it holding above the 13 EMA.

The daily MACD crossed up signaling a buy. Looking to see if tomorrow confirms the signal.

Opt 1 - 5 Min
At first glance, it appears that five waves up are complete. If so, wave 1 should be deemed complete and a wave 2 pullback should be expected. 1160 looks like it would be a good target.

However, it is very possible wave iii is extending. I'll have to take a look at the squiggles later to confirm. Should wave iii be extending, 1191 would make for a good target since it represents the 1.62 extension of 1 plus close the gap at 8/17.

Opt 1 - Daily

Here's the larger view. The 5 min chart above is working on five waves up to complete wave c of B. One thing I will throw out there is the potential for a triangle to form for wave B yellow. Since it is too early to tell, I'll just leave it at that.

I'll address it more later should it start to really show it's hand. Until then, I'm going to assume that wave B yellow will be a sharp zigzag up to counteract the extreme selling we saw earlier this month.
60 Min - Adam and Eve Double Bottom

This pattern continues to build and the daily MACD bull cross may help confirm this notion. 1208 is the key here.

Daily Bollinger Band W Bottom

The 20 day SMA looks like a good target at minimum. 1208 is also key here.


The bearish alternate is in jeopardy. The market needs to reverse early tomorrow if this count is to survive.

A move above 1208 will invalidate this count.