Showing posts with label Good Call. Show all posts

Wednesday, October 8, 2014

10/8/14 - AM Update

[11:35 AM] - If the bulls can clear the red horizontal line,  it would further favor the purple count.

11:35 AM - 5 Min 


[11:25 AM] - Double bottom indeed. Anyone buy it?

11:25 AM - 1 min 


[7:42 AM] - No more charts for the next few hrs. Lets see if this is the last push for dbl bottom. Gotta run. GLTA!

7:42 AM - 1 Min


[7:24 AM] - I like the odds of the purple count at the moment. This would also serve well should this double bottom at 1926.

7:24 AM - 1 Min 

7:24 AM - 5Min


[6:40 AM] - Based on the 5 min chart either,

1. Wave {ii blue is complete
2.  Wave c of Y purple is complete
3.  Wave (iii complete
4.  Five waves complete out of the triangle for a larger degree five wave move down from 10/6.

6:40 AM  - 5 Min 

[6:38 AM] - Five completed after the tri.


6:38 AM - 1 Min 

Thursday, October 2, 2014

10/2/14 - EOD Updated


I wonder if tomorrow will be a buy a Yom Kippur moment. I have an inverted H/S pattern setting up for a rally to 1975 on the 1 min.

The daily chart still supports a good completed wave iv for my ED.

The bears still have their extending wave count on the 5 min. The bulls need to clear 1966 (blue horizontal line) to create another overlap, which would bring into question a larger degree five wave move down for the bears.

If 1966 were to be cleared, the next best count for the bears is a large degree nested 1-2 i-ii down. If this becomes the bear's best count, the bulls need to take out 1985, which result result in wave ii retracing beyond the start of wave i.

I bought the lil dip today after the five waves up completed on the 1 min chart. We'll see what happens tomorrow.

1 Min 

5 Min 

Daily

60 Min  H/S

Friday, September 19, 2014

9/19/14 - EOD Update

[8:14 PM] - After looking at my long term chart again, I think today's ATH may have completed wave iii of  the ED I have been tracking on the daily chart.

However, if the bulls show up and blast this higher, I have an extended wave 5 of [3] count to present. Won't do it unless the ED fails.

8;14 PM - Daily


[EOD Update] - I may have missed an opportunity to score some points to the downside for next week. Based on my 1 min chart, I'm expecting a wave iii or c down.

That downside may be limited based on the more bullish count on the 60 min chart.

However, I'm keeping an eye on the daily count, which has an ending diagonal in the works.

Have a great weekend.

1 Min 

60 Min 

Daily

Friday, September 5, 2014

9/5/14 - AM Update

[12:26 PM] - A wave iv triangle or v ED?

12:26 PM - 1 Min 


[11:41 AM] - We'll see if this squiggle plays out. Not a bad time to take profits on this bounce in case it doesn't. Near the top of the range now.


11:41 AM - 1 Min 


[9:44 AM] - Don't you love it when a plan comes together?

9:44 AM - 1 Min 


[7:53 AM] - May have five waves down. Let's see if it bounces from here.

7:53 AM - 1 Min 


[7:27 AM] - Now remember, unless this flushes past 1990,  this could be five waves down for wave {c of this count. How likely is it? I'm not too sure but even with the bearish H/S potentially setting up, this may still be a good place for a bounce to set the neckline and bounce from here. So probably not a bad place to trade this at the lower end of the trading range.

7:27 AM - 60 Min 


[7:21 AM] - A possible squiggle count. Need to double check my previous count.

7:22 AM - 1 Min 

Wednesday, November 7, 2012

11/7/12 - EOD Update

SPX - 60 Min 
 Could the correction be over?

SPX - Weekly
Maybe? If there is a year end rally in store the blue line marks the spot.

AAPL - 60 Min 

AAPL - Weekly
Not so very good looking for AAPL.

AAPl - Weekly 
Another way to look at the potentially larger H/S for AAPL. Lets keep an eye on this one too.


Tuesday, October 2, 2012

10/2/12 - EOD Update [1:53 PM Update]

[1:53 PM Update] 

AAPL Daily

Forgot to add the daily -ve MACD divergence as well.

 EOD Update
15 Min
Looks like near term the market broke out of the falling wedge and continues to post higher lows so I would favor the green option, which is calling for a wave iii move higher tomorrow.

However, the purple count also adds the option that a leading diagonal wave {a} of y completed with a {b} bounce that started into the close.

As you will see with AAPL below, the potential head and shoulders pattern for AAPL could be hinting that the purple option may have some credibility.

60 Min
 Looks like wave iii of 5 may be on its way.

AAPL Daily
AAPL found support at the 50 day today and an hourly MACD +ve divergence forming. Lets see how high the bounce goes since the 20 day has rejected a previous bounce already.

AAPL's right shoulder may not be complete yet and may need to form which would also correspond with SPX's final 5th wave completion.

Thursday, December 22, 2011

12/22/11 - EOD Update - Golden Cross Watch and Inverted Head and Shoulders [10:55 PM Update]

[10:55 PM Update]

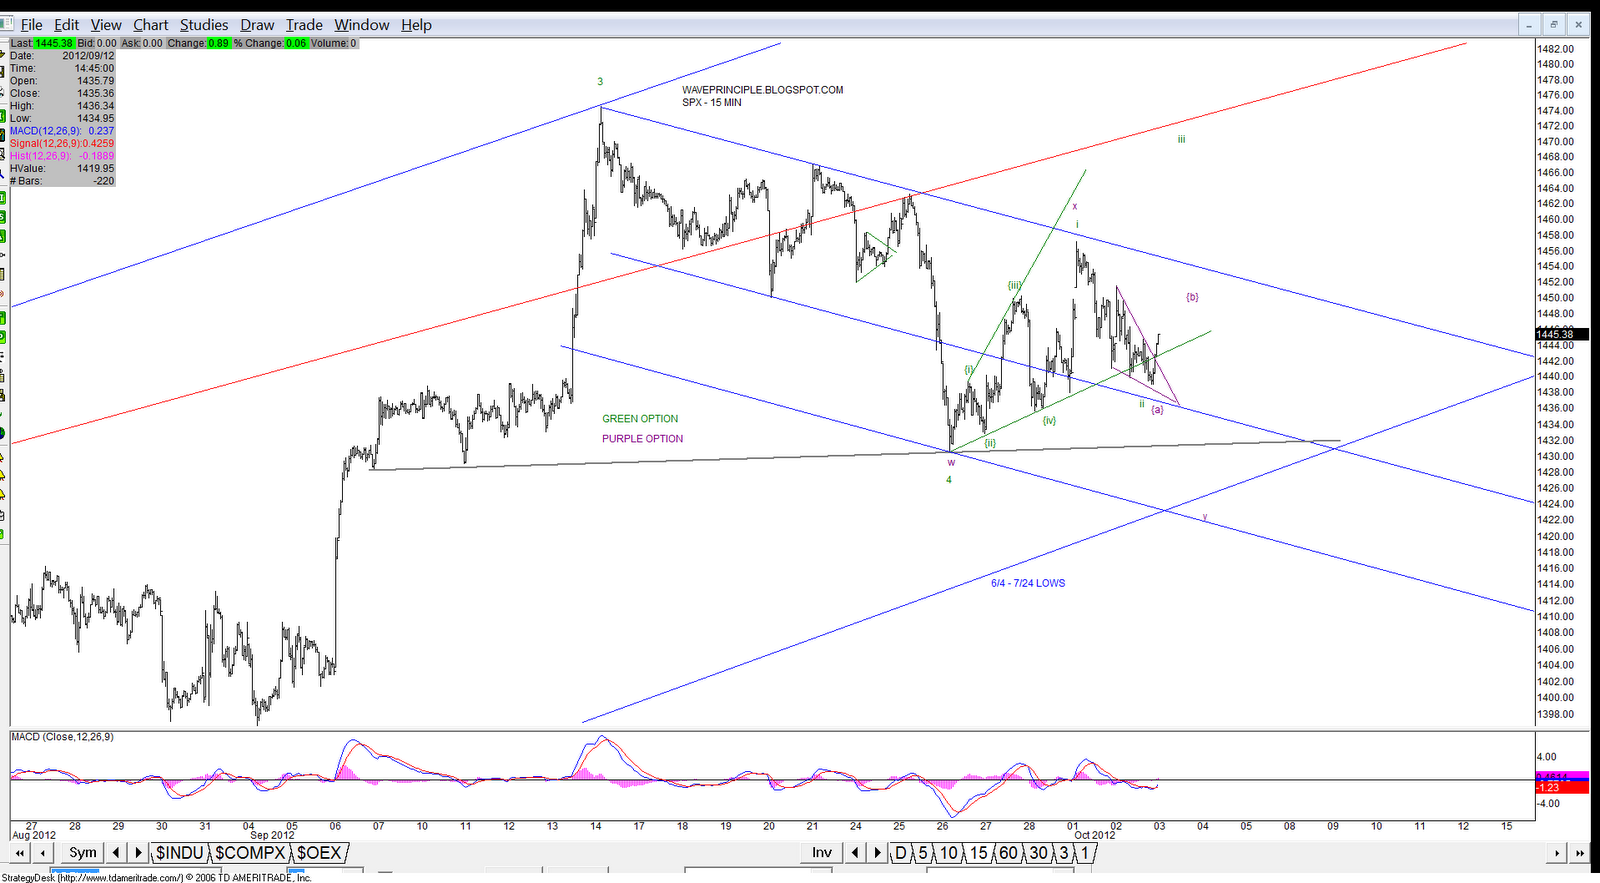
SPX - 15 Min - Option 2
This is a follow up to my earlier post under the 30 min Primary chart. This assumes that the market is working towards five waves up and that wave 3 completed today.

If this is the case, I  will be looking for a wave 4 pullback towards the 1247 level. From there, wave 5 = 3 at 1273 and 5=.618*1 at 1273 as well.

This is a speculative count at the moment.


EOD Update
I'm pretty satisfied with today's action based on last night's post. Today's post is going to seem a little bullish biased but I think there are things lining up that may justify it. However, the major caveat as I have previously mentioned, is that the bulls need to break through the descending trendline connecting the 7/7 and 10/27 highs and ultimately take out 1292.

With today's move and close over 1250, I believe there is a good chance that the market will attempt to challenge 1292 over the next week and/or possibly into the first week of January 2012.

Near term, the market may have a little weakness (or maybe more depending how the VIX is interpreted) but I believe the dip can be bought per the primary count I am currently tracking.

**Note: I'm not sure if all the multiple alternates I post confuse readers here. Please keep in mind that the primary will always be the count I focus on until it is ruled invalid. 


Readers should also keep in mind that if an alternate count(s) point in the same direction as the primary, then it only helps to confirm which side of the trade to be on.  

SPX - 5 Min - Primary

Here's the breakdown at the 5 min level. I believe that wave 1 grey of 3 blue completed today at 1255.22 and that wave 2 grey started.

SPX - 30 Min - Primary
The 30 min MACD ended the day with a sell signal so this may fall in line with a pullback for wave  2 grey of 3 blue.

Please read the note on the chart. I believe there may be a chance that the entire wave up from the 12/19 low may be working five waves up versus a nested 1-2 1-2. I did not add the alternate labels so as not to clutter the chart. Should the market spike briefly at the open tomorrow and then pullback and hold between the 1245-1250 level, I will make the adjustment.

SPX - 5 Min - Alternate Extended 3 Count
This alternate count views the wave off wave 2 blue as an extended wave 3. Per the count, this would only complete wave 1 grey of 3 blue near 1259, which would then be followed by wave 2 grey.

But, as noted above on the 30 min primary count, this may be all of wave 3 blue once complete. If so, this should wrap up early tomorrow at 1259 and then be followed by a wave 4 blue pullback that consolidates for the remainder of the trading day.

SPX - Daily - Bullish Triangle Alternate
Just another view that supports higher prices ahead.

SPX - Daily 50 / 200 SMA
The title of today's post. This daily chart just looks fairly bullish to me, especially when considering my bullish counts.

1. There is a MACD buy signal today that will require confirmation tomorrow.
2. The 50 day SMA is rising fast towards the 200 day SMA.
3. This will be the market's 4th attempt at the 200 day SMA and per Gann's rule of 4, the market just may break through.

SPX - Daily
I haven't really seen anyone talking about the inverted head and shoulders as much lately other than Pug. Let's not forget this especially as the 7/7 - 10/27 TL is crucial for the bulls to break through.

If it plays out, I show a target of approximately 1380, basically challenging the July high.

SPX - Daily 
I just had to post this since I love it when these quirky observations play out. I brought this up on Tues. 

SPX - Daily - Bearish Triangle Alternate
As I mentioned above, the bulls aren't out of the woods yet. This bearish triangle option must not be ignored.

However, I did mention yesterday that a daily MACD cross would begin to weaken this scenario.

VIX- Daily
The VIX found support today on the descending trendline and at the 6/6/11 high. The candlestick resembles a hammer as well so this may be lining up with the wave 2 pullback for SPX or the thrust down out of the bearish triangle.

Wednesday, December 21, 2011

12/21/11 - EOD Update [8:51 PM Update]

[8:51 PM Update]

SPX - 3 Min - Extended Wave 3 Option
Earlier in the CiL today I was asked if my primary count expected a gap and go wave 3 tomorrow. At the time, based on the squiggle count and based on the initial EOD post today (see below), I was not expecting that.

However, I took a look at the squiggles again just in case this may be possible should the market react positively to the initial claims report tomorrow.

The chart above would be considered the count should the market gap and go tomorrow.

[5:21 PM Update]


SPX - Daily - Bullish Triangle Alternate
This is the triangle alternate that also supports my primary daily chart below. Notice how this also fulfills the larger flat as annotated on the daily primary below?

[4:43 PM Update]

I'm not sure if everyone checks the CiL or my tweets for misc charts that I post so I'll post them here again.

SPX - Daily 
 A follow up to yesterday's post.

SPX - Daily 
 Something I have been tracking since July 2010.

TNX -4 hr
The 10 year yield broke out of a wedge which I labeled five waves up. It then retraced the wedge 88.5% in a corrective fashion and has since bounced. Notice the MACD buy signal as well?

EUR/USD
Keep an eye on the + MACD divergence there.

EOD Update

The market found buyers at the 50 day SMA and formed a bullish falling wedge. The bounce triggered a 30 min MACD buy signal (confirmation needed) and the daily MACD curling up looking to signal a buy of it's own.

SPX - 5 Min - Primary
The primary count is that wave 3 blue up is in progress. I'm still looking for the completion of wave 1 of 3 blue.

The level to watch to invalidate this count is 1238.91. Should the market move below this tomorrow at the open, the alternate will take the driver seat.

The alternate here is that a wave 2 blue flat is in progress. The new intraday high capped off the end of wave b of 2 of an expanded flat.

I'm not a big fan of the irregular 2 flat so should wave c begin tomorrow, I may relabel the move up from 12/19 as a wave a and b as the irregular flat.

SPX - 30 Min - Primary

SPX - Daily - Primary
The overall picture.
SPX - Weekly - Triangle Bear

As mentioned in yesterday's post, this bearish triangle option should not be ignored and the bulls are not out of the woods yet. The bulls will need to clear the upper TL, which so happens to coincide with the 200 day SMA, and clear 1292 to remove this option off the table.

Notice that this count is looking for the completion of wave e of b blue. So far the move off 12/19 counts as a three wave structure so this count is surely worth watching.

But keep in mind the daily MACD is on the verge of triggering a buy signal and should that happen, that would diminish the probability of this count. As always, we shall see.