[10:05 PM Update]

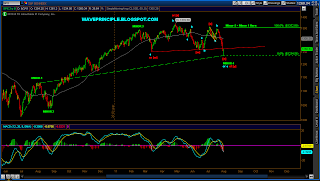
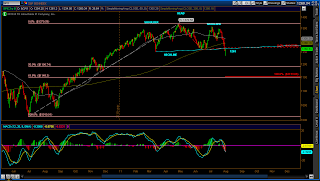
Here's an update to this chart I posted back on 7/2 along with the Elliott Wave Oscillator on 7/17. It's the same as the 5 Year Bull Chart I posted earlier via TOS.
I wanted to highlight the Fibonacci confluences again.
[9:54 PM Update]
 Bounced right at the yellow 62% Fib fan. Hmm..
[9:37 PM Update]
 Adding to the potential repeat of the failed H/S is the potential for a second daily positive MACD divergence. This may provide a clue as to whether or not a new high is coming.
 I'll be watching this one carefully.

[9:00 PM Update]
 Should we treat these as ascending triangles instead of the bearish head and shoulders?
EOD Update
The market pulled off a 25 pt reversal today and formed a hammer with a very long lower shadow. I say that's signaling that the market is at least due for a bounce. Perhaps target the 200 day SMA at the least?
 The triangle is dead, however, I still believe the wave structure over the past 6 months has been a very complex corrective consolidating a trend that has been up for over 8 months.
However, this chart has it in a wave 4 of a larger degree, which I think may be more applicable. This count is out if 1219.80 is breached below.
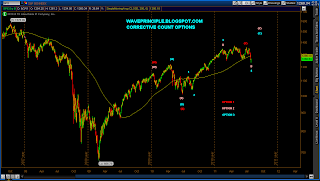
Though not an impulsive count, these corrective count options I have been following also allow for new highs to come.
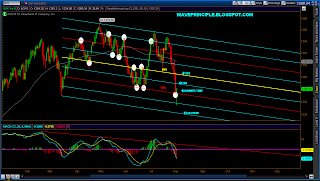
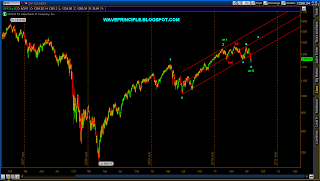
Channels to watch.
 This bearish head and shoulders pattern is being watched by all. This was the headline on CNBC right at the close. So now that everyone is watching this, will it play out or fail again like it did back in July of 2010?

 Here's the near term bear count. So far three waves down are complete or nearly complete. The wave 4 bounce will determine if there is a new impulse down. 1295 is the key to this. A rally back over 1295 will result in a wave 4 overlap into 1 and rule out the impulse down.

RUT- Daily
[9:00 PM Update]
 Should we treat these as ascending triangles instead of the bearish head and shoulders?
EOD Update
The market pulled off a 25 pt reversal today and formed a hammer with a very long lower shadow. I say that's signaling that the market is at least due for a bounce. Perhaps target the 200 day SMA at the least?
Closing back above the 1250 level was also key in showing that the bottom of the 6 month range is still in play.
The first two charts below highlight counts that are looking for new highs to come.
 The triangle is dead, however, I still believe the wave structure over the past 6 months has been a very complex corrective consolidating a trend that has been up for over 8 months.
 If that is correct, the above count is one way of viewing it.

5 Year Bull

Though not an impulsive count, these corrective count options I have been following also allow for new highs to come.

Channels to watch.
 This bearish head and shoulders pattern is being watched by all. This was the headline on CNBC right at the close. So now that everyone is watching this, will it play out or fail again like it did back in July of 2010?
Today's rally into the close may only be a backtest of the broken neckline. We'll have to see if it's rejected or gaps back over.
As of this writing, ES (SPX futures) is up approximately 5 pts. Should this be maintained, it should gap over into the open.
 Here's the near term bear count. So far three waves down are complete or nearly complete. The wave 4 bounce will determine if there is a new impulse down. 1295 is the key to this. A rally back over 1295 will result in a wave 4 overlap into 1 and rule out the impulse down.